Car dealership group financial model, built free.
A three-statement Excel model for a car dealership group, built from your own figures and checked to balance.
- Free account
- No card
- Usually ready within the hour
We use generative AI in parts of our process, so mistakes can occur. Every model should be checked by a person before it is relied on. Read more
Holds franchises from vehicle manufacturers to sell new vehicles, retails and wholesales used vehicles, earns finance and insurance commissions and runs service and parts departments, funding vehicle stock with floorplan finance.
In short
- 01
Three linked statements
Income statement, balance sheet and cash flow, linked in every period.
- 02
Valued three ways
Discounted cash flow, trading multiples and net asset value, side by side.
- 03
Monthly to annual
Monthly, quarterly, half-yearly or annual periods, for up to 30 years.
- 04
Checked every period
A Checks sheet shows the balance sheet balances and the cash reconciles.
The sample, as Excel draws it.
Built by the same system and checks as yours, on illustrative figures: every sheet as Excel draws it, or live.
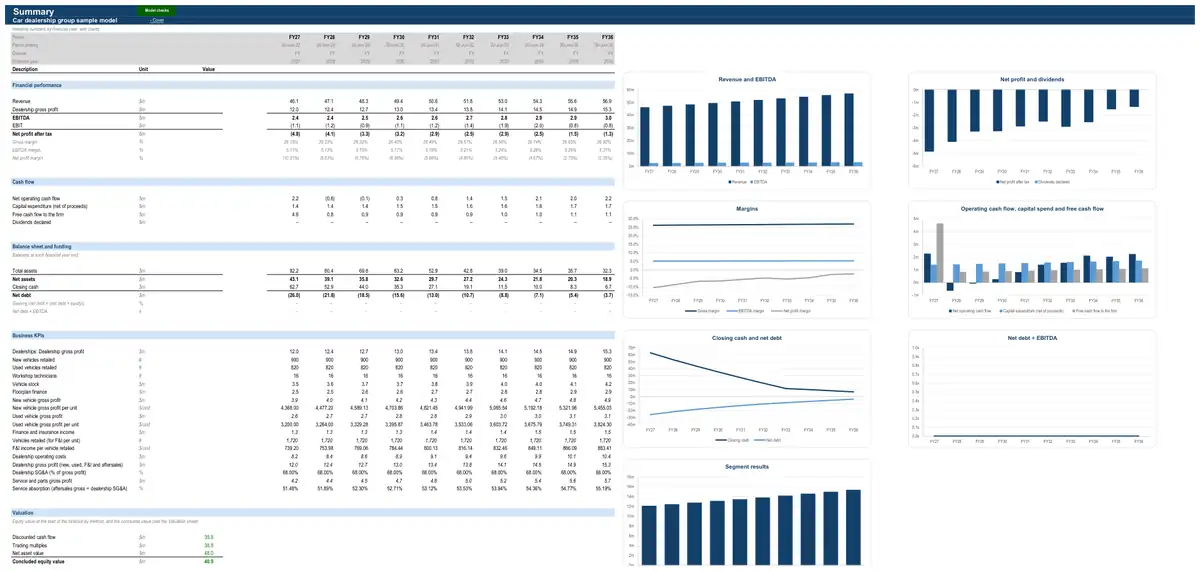
Illustrative figures: the sample describes no real business. The live preview shows values; your model’s Excel file has every formula.
How the model works for a car dealership group.
- How it earns revenue3 formulasNew vehicle sales · All dealershipsAgency commission revenueFixed commissionVariable commissionPerformance commissionNew vehicle sales · All dealershipsNew vehicle gross profit (commission)Agency commission revenueNew vehicle cost of sales (none under agency)from none under agencyUsed vehicle sales · All dealershipsUsed vehicle revenueUsed vehicles retailedAverage used transaction price
- What drives its costs1 formulaDealership operating costs · All dealershipsDealership gross profitNew vehicle gross profitUsed vehicle gross profitFinance and insurance income (finance and insurance income)from finance and insurance incomeService and parts gross profit
- What it invests in3 formulasCorporate fixed assetsCapital expenditureRevenuefrom statementsCapex as % of revenueAdditional planned capexCorporate fixed assetsDepreciationDepreciation of the opening asset baseDepreciation of new capexCorporate fixed assetsClosing net book valueOpening net book valueCapital expenditureDepreciation
- How it is funded3 formulasVehicle stock and floorplan finance · All dealershipsVehicle stockNew vehicle stockUsed vehicle stockVehicle stock and floorplan finance · All dealershipsNet drawdowns (repayments)Closing floorplanOpening floorplanVehicle stock and floorplan finance · All dealershipsClosing floorplanNew vehicle stockFloorplan advance rate on new stockUsed vehicle stockFloorplan advance rate on used stock
- How profit becomes cash3 formulasWorking capitalTrade receivablesRevenuefrom statementsDebtor daysDays in periodWorking capitalInventoryDirect costs (positive)from statementsInventory daysDays in periodWorking capitalTrade payablesCash operating costs (positive)from statementsCreditor daysDays in period
19 parts, each one tested.
Every part is a tested building block with its own checks: yours is put together from the ones your business needs.
- CPI forecastConsensus curve with long-run anchor
- Corporate costsFixed cost base indexed to CPI
- Working capitalFull working capital
- Income taxCorporate rate with tax losses
- Corporate fixed assetsStraight-line over remaining life
- DebtAmortising term loan
- Dividends and distributionsPayout of net profit
- Discounted cash flow valuationDCF on free cash flow to the firm
- Multiples valuationEV / EBITDA multiple
- Net asset valueBook net asset value
- Interest-rate hedgingHedged share at a fixed rate
- LeasesLease register
- Interest-rate forecastMarket forward curve
- New vehicle salesAgency commissionNew vehicles retailed, their revenue and cost, and the manufacturer incentives that make up much of the margin.
- Used vehicle salesUsed-to-new ratio × gross per unitUsed vehicles retailed and wholesaled, their gross profit and the effect of stock ageing and used-car prices.
- Finance and insurance incomePenetration × amount × commissionCommissions from arranging finance, insurance, warranty and protection products, net of commission chargebacks.
- Service and partsTechnician hours × productivity × labour rateWorkshop labour, warranty work and parts sales — the recurring aftersales earnings of a dealership.
- Vehicle stock and floorplan financeDays supply × advance rateNew and used vehicle stock, the floorplan facilities that fund it, floorplan interest on the opening balance, and manufacturer assistance that offsets it.
- Dealership operating costsSG&A as a % of gross profitSales commissions, salaried staff, advertising, occupancy and other selling, general and administrative costs.
The numbers it tracks.
- 01new and used units
- 02gross profit per vehicle retailed
- 03F&I per unit
- 04service absorption
- 05days supply
- 06floorplan interest
- 07SG&A to gross profit
- 08EBITDA
What it is used for.
- Operating forecastGuide · Financial projections
- Budget and rolling forecastGuide · Cash flow forecast
- Lending and credit analysisGuide · Three-statement model
- Merger or acquisition (strategic)Guide · Financial modelling services
- ValuationGuide · DCF valuation model
- Asset acquisition
More in automotive services.
Looking for a car dealership group financial model template? Ours arrives built for your business, with your figures in it.
Running a small business? Read what goes into a small business financial model.
See a finished model, sheet by sheetThe sample is built on illustrative figures and describes no real business. Models are calculations prepared from the information you provide. They are not financial advice and must be independently verified. See our terms.