EV charging network financial model, built free.
A three-statement Excel model for an EV charging network operator, built from your own figures and checked to balance.
- Free account
- No card
- Usually ready within the hour
We use generative AI in parts of our process, so mistakes can occur. Every model should be checked by a person before it is relied on. Read more
Builds and operates public fast-charging, destination and fleet-depot chargers, earning a price per kWh plus session, idle and subscription fees above electricity and demand charges, as utilisation ramps with electric vehicle adoption.
In short
- 01
Three linked statements
Income statement, balance sheet and cash flow, linked in every period.
- 02
Valued and tested
Discounted cash flow, with scenarios on the key drivers.
- 03
Monthly to annual
Monthly, quarterly, half-yearly or annual periods, for up to 30 years.
- 04
Checked every period
A Checks sheet shows the balance sheet balances and the cash reconciles.
The sample, as Excel draws it.
Built by the same system and checks as yours, on illustrative figures: every sheet as Excel draws it, or live.
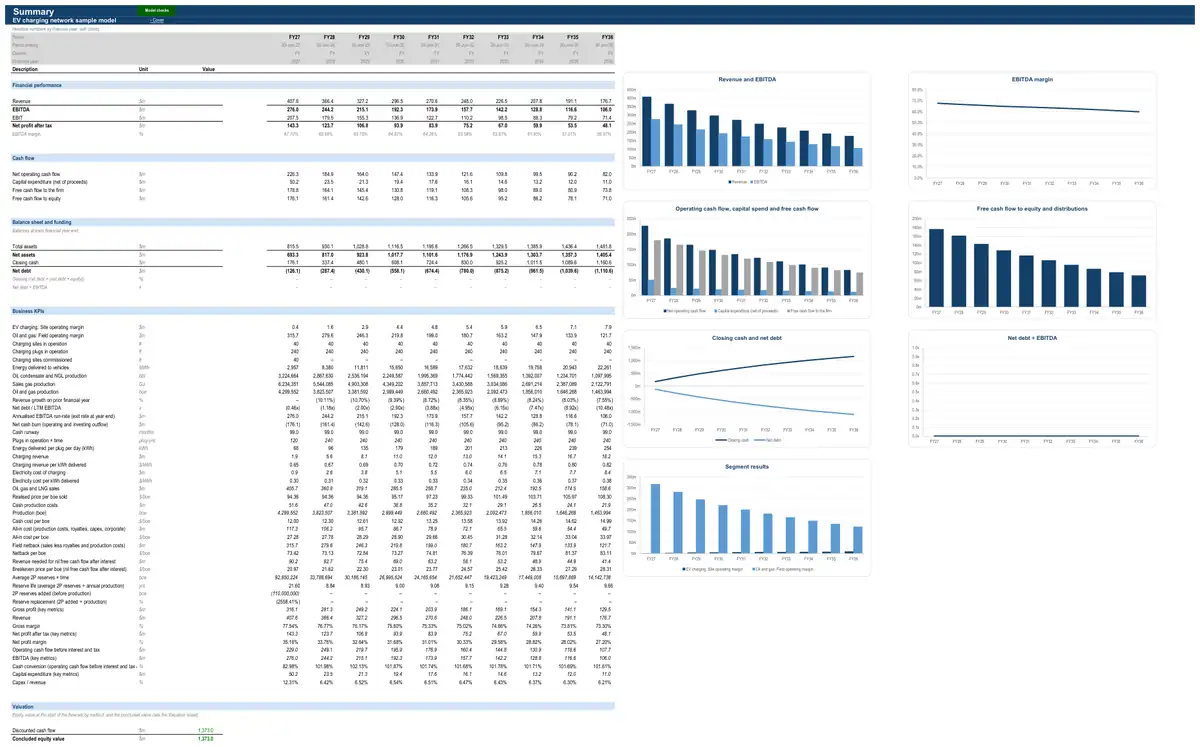
Illustrative figures: the sample describes no real business. The live preview shows values; your model’s Excel file has every formula.
How the model works for an EV charging network.
- How it earns revenue3 formulasCharging revenue · All charging sitesCharging revenueEnergy delivered to vehiclesPrice per kWhCharging revenue · All charging sitesEnergy delivered to vehiclesPlugs in the cohort when completefrom charging site register and rolloutShare of the cohort in operation over the periodfrom charging site register and rolloutDays in periodThroughput per plug per dayOil, gas and LNG sales · Oil and gas asset 1Oil, gas and LNG salesOil, condensate and NGL salesGas sales
- What drives its costs3 formulasElectricity cost · All charging sitesElectricity costElectricity drawn from the gridAll-in tariffSite operating costs · All charging sitesSite operating costsMaintenance and warrantySoftware, network and communicationsPayment processingSite host rentRoyalties and resource taxes · Oil and gas asset 1RoyaltiesWellhead valueRoyalty rate
- What it invests in3 formulasCharger capex and depreciation · All charging sitesCharger and site capexChargers installedGrid connection and civil worksCharger capex and depreciation · All charging sitesCharger depreciationDepreciation of the opening book valueDepreciation of chargers addedCharger capex and depreciation · All charging sitesCharging assets net book valueClosing book value of live sitesBook value of chargers added (closing)
- How it is funded3 formulasDebtClosing balanceOpening balanceDrawdownsRepaymentsDebtInterest expenseOpening balanceAll-in interest rateshare of the yearEquity raisingEquity raisedEquity raised (net of costs)Equity from an offer, milestone funding, conversions and creditor shares
- How profit becomes cash3 formulasWorking capitalTrade receivablesRevenuefrom statementsDebtor daysDays in periodWorking capitalInventoryDirect costs (positive)from statementsInventory daysDays in periodWorking capitalTrade payablesCash operating costs (positive)from statementsCreditor daysDays in period
24 parts, each one tested.
Every part is a tested building block with its own checks: yours is put together from the ones your business needs.
- CPI forecastCPI glide path
- Operating expensesFixed plus variable operating expenses
- Corporate costsFixed cost base indexed to CPI
- Working capitalDays-based working capital
- Income taxCorporate rate with tax losses
- DebtSingle debt facility
- Equity raisingScheduled equity raisings
- Discounted cash flow valuationDCF on free cash flow to the firm
- Energy and utility KPIsUpstream unit metricsThe ratios investors and lenders use to judge energy and utility businesses.
- Key-metric summaryLast-twelve-month and run-rate metrics
- Discount rate (WACC)CAPM at target gearing
- Burn and runwayRunway to the forecast cash-out date
- Exchange rate (US dollar)Flat exchange rate
- Charging site register and rolloutRollout by annual cohortThe plugs, power rating and commissioning timing every other part of the model builds on.
- Charging revenuekWh per plug per day × priceEnergy delivered to vehicles and the revenue from it, plus session, idle, subscription and fleet fees.
- Electricity costAll-in tariff per kWhThe cost of electricity delivered to vehicles, including network demand charges.
- Site operating costsCost per charger plus host rentMaintenance, software, payments and site host costs.
- Charger capex and depreciationInstalled cost per plug by charger classChargers, grid connections and civil works, grants received, replacements and depreciation.
- Field and project registerInterest, reserves and book valueWorking interest, reserves and carrying value of each field or LNG project.
- ProductionExponential declineOil, gas and LNG volumes produced each period (net to the company's interest).
- Oil, gas and LNG salesBenchmark × differential by productRealised prices × volumes for oil, condensate, gas and LNG.
- Royalties and resource taxesRoyalty on wellhead valueGovernment and private royalties, production sharing and petroleum resource taxes.
- Production costsCost per boeLifting, processing, transport and liquefaction costs.
- Capex, depletion and explorationUnits-of-production depletionDevelopment and sustaining capex, exploration spend, and depletion of oil and gas properties.
The numbers it tracks.
- 01sites and plugs
- 02utilisation (kWh per plug per day)
- 03revenue and margin per kWh
- 04site EBITDA
- 05capex per plug net of grants
- 06payback
What it is used for.
- Operating forecastGuide · Financial projections
- Budget and rolling forecastGuide · Cash flow forecast
- ValuationGuide · DCF valuation model
- Equity capital raisingGuide · Startup financial model
- Lending and credit analysisGuide · Three-statement model
- Startup and venture fundingGuide · Startup financial model
- Project financeGuide · Financial modelling services
- Scenarios and sensitivities
More in energy retail and services.
- Energy retailer financial model
- Gentailer financial model
- Distributed energy provider financial model
- Solar installer financial model
- Energy trading company financial model
Looking for an EV charging network financial model template? Ours arrives built for your business, with your figures in it.
See a finished model, sheet by sheetThe sample is built on illustrative figures and describes no real business. Models are calculations prepared from the information you provide. They are not financial advice and must be independently verified. See our terms.