Securities exchange and market operator financial model, built free.
A three-statement Excel model for a securities exchange and market operator, built from your own figures and checked to balance.
- Free account
- No card
- Usually ready within the hour
We use generative AI in parts of our process, so mistakes can occur. Every model should be checked by a person before it is relied on. Read more
Operates listing, trading, clearing and settlement infrastructure, earning fees on each plus data and technology services and interest on collateral balances.
In short
- 01
Three linked statements
Income statement, balance sheet and cash flow, linked in every period.
- 02
Valued two ways
Discounted cash flow and trading multiples, side by side.
- 03
Monthly to annual
Monthly, quarterly, half-yearly or annual periods, for up to 30 years.
- 04
Checked every period
A Checks sheet shows the balance sheet balances and the cash reconciles.
The sample, as Excel draws it.
Built by the same system and checks as yours, on illustrative figures: every sheet as Excel draws it, or live.
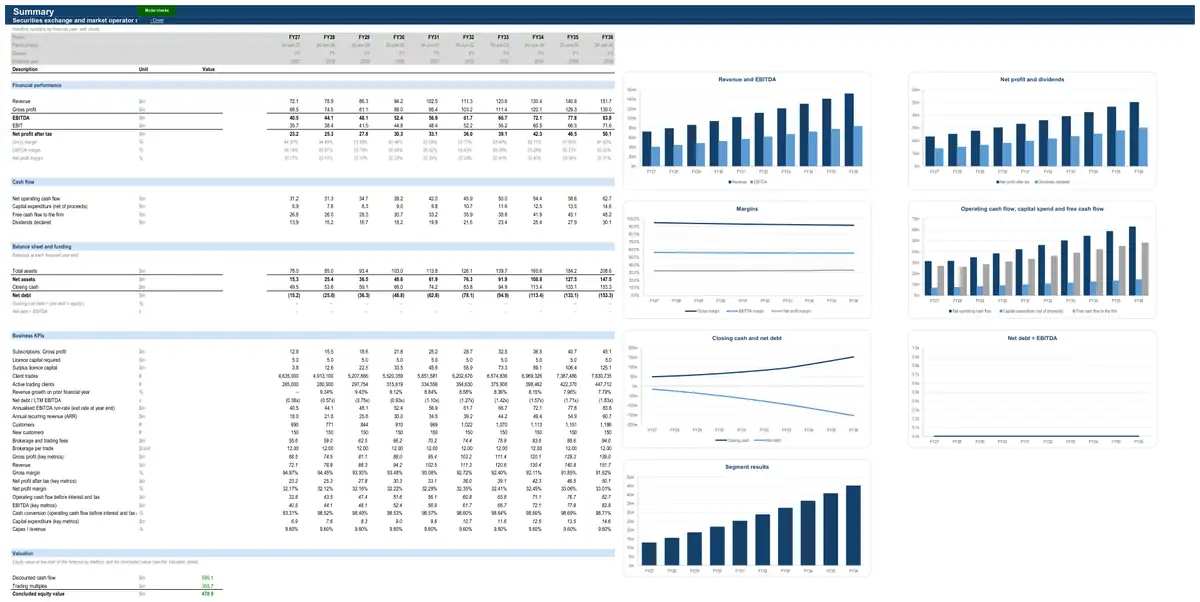
Illustrative figures: the sample describes no real business. The live preview shows values; your model’s Excel file has every formula.
How the model works for a securities exchange and market operator.
- How it earns revenue3 formulasRecurring revenue and ARR · All product plansSubscription revenueOpening ARRClosing ARRshare of the yearRecurring revenue and ARR · All product plansNew customer ARRNew customersfrom new customers and sales and marketingARR per new customerRecurring revenue and ARR · All product plansNet expansion ARRPrice increase on the installed baseUpsell and cross-sell (net of contraction)
- What drives its costs3 formulasCost of revenue · All product plansCost of revenueHosting and infrastructureCustomer support and successNew customers and sales and marketing · All product plansSales and marketingCustomer acquisition spend (new logos)Account management and renewalsNew customers and sales and marketing · All product plansCustomer acquisition spend (new logos)New customersCustomer acquisition cost (CAC)
- What it invests in3 formulasCorporate fixed assetsCapital expenditureRevenuefrom statementsCapex as % of revenueAdditional planned capexCorporate fixed assetsDepreciationDepreciation of the opening asset baseDepreciation of new capexCorporate fixed assetsClosing net book valueOpening net book valueCapital expenditureDepreciation
- How it is funded3 formulasDebtRepaymentsScheduled repaymentsPrepayments from an equity raise and the cash sweepDebtClosing balanceOpening balanceDrawdownsRepaymentsDebtInterest expenseOpening balanceAll-in interest rateshare of the year
- How profit becomes cash3 formulasWorking capitalTrade receivablesRevenuefrom statementsDebtor daysDays in periodWorking capitalInventoryDirect costs (positive)from statementsInventory daysDays in periodWorking capitalTrade payablesCash operating costs (positive)from statementsCreditor daysDays in period
22 parts, each one tested.
Every part is a tested building block with its own checks: yours is put together from the ones your business needs.
- CPI forecastConsensus curve with long-run anchor
- Operating expensesHeadcount build by function
- Corporate costsFixed cost base indexed to CPI
- Working capitalFull working capital
- Income taxCorporate rate with tax losses
- Corporate fixed assetsStraight-line over remaining life
- DebtAmortising term loan
- Dividends and distributionsPayout of net profit
- Discounted cash flow valuationDCF on free cash flow to the firm
- Multiples valuationEV / EBITDA multiple
- Licence capital and liquidity requirements (non-banks)NTA and liquidity requirementMinimum capital, net tangible assets and liquid funds required of licensed non-bank firms, and the surplus available for dividends.
- Broking and exchange revenueTrades × fee per tradeBrokerage, exchange, clearing and capital-markets fees driven by traded value, trades and capital raised.
- Key-metric summaryLast-twelve-month and run-rate metrics
- Case selectionStackable stress toggles
- Value per shareTreasury-stock method
- R&D and capitalised developmentGross R&D × capitalisation rate
- Interest-rate forecastMarket forward curve
- Enterprise value to equity bridgeNet debt at the valuation date
- New customers and sales and marketingNew customers per period × CAC
- Customer base and churnConstant churn rate
- Recurring revenue and ARRARR bridge on ARPA with price increases and net expansion
- Cost of revenueHosting and support as % of revenue
The numbers it tracks.
- 01revenue by segment
- 02traded value
- 03listings
- 04data subscriptions
- 05EBITDA margin
- 06capex
- 07EPS
What it is used for.
- Operating forecastGuide · Financial projections
- Budget and rolling forecastGuide · Cash flow forecast
- ValuationGuide · DCF valuation model
- Scenarios and sensitivities
More in markets, payments and financial infrastructure.
- Payments company financial model
- Stockbroker financial model
- Investment bank financial model
- Fund administrator financial model
- Financial data provider financial model
- Crypto exchange financial model
Looking for a securities exchange and market operator financial model template? Ours arrives built for your business, with your figures in it.
See a finished model, sheet by sheetThe sample is built on illustrative figures and describes no real business. Models are calculations prepared from the information you provide. They are not financial advice and must be independently verified. See our terms.