Mining royalty and streaming company financial model, built free.
A three-statement Excel model for a royalty and streaming company, built from your own figures and checked to balance.
- Free account
- No card
- Usually ready within the hour
We use generative AI in parts of our process, so mistakes can occur. Every model should be checked by a person before it is relied on. Read more
Buys royalties and metal streams over mines operated by others, earning a share of revenue or metal deliveries at a fixed cost without operating risk.
In short
- 01
Three linked statements
Income statement, balance sheet and cash flow, linked in every period.
- 02
Valued three ways
Discounted cash flow, trading multiples and net asset value, side by side.
- 03
Monthly to annual
Monthly, quarterly, half-yearly or annual periods, for up to 30 years.
- 04
Checked every period
A Checks sheet shows the balance sheet balances and the cash reconciles.
The sample, as Excel draws it.
Built by the same system and checks as yours, on illustrative figures: every sheet as Excel draws it, or live.
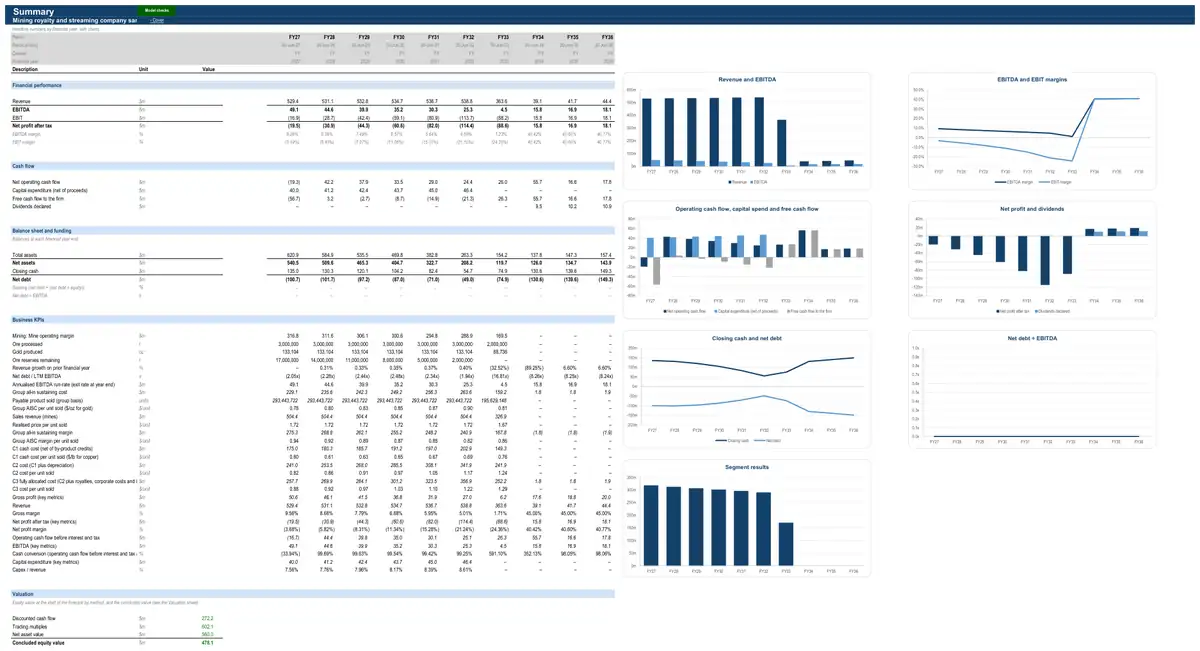
Illustrative figures: the sample describes no real business. The live preview shows values; your model’s Excel file has every formula.
How the model works for a mining royalty and streaming company.
- How it earns revenue3 formulasSales and realised prices · Mine 1Gold salesHedged salesSpot salesSales and realised prices · Mine 1Gold spot priceGold spot price, last periodAnnual gold price change1 in the first period of each yearRevenue (top-down) · Across the businessRevenueUnits soldAverage price
- What drives its costs3 formulasRoyalties · Mine 1RoyaltiesGold salesfrom sales and realised pricesRoyalty rateSite operating costs · Mine 1Site operating costsMining costsProcessing costsSite general and administrationDirect costs (top-down) · Across the businessCost of salesRevenuefrom statementsGross margin
- What it invests in3 formulasMine assets and depreciation · Mine 1Mine capital expenditureMine development capexfrom development and first productionSustaining capexGrowth capexMine assets and depreciation · Mine 1Depreciation and amortisation (units of production)Opening net book valueMine capital expenditureShare of remaining reserves minedMine assets and depreciation · Mine 1Closing net book valueOpening net book valueMine capital expenditureDepreciation and amortisation (units of production)
- How it is funded3 formulasDebtRepaymentsScheduled repaymentsPrepayments from an equity raise and the cash sweepDebtClosing balanceOpening balanceDrawdownsRepaymentsDebtInterest expenseOpening balanceAll-in interest rateshare of the year
- How profit becomes cash3 formulasWorking capitalTrade receivablesRevenuefrom statementsDebtor daysDays in periodWorking capitalInventoryDirect costs (positive)from statementsInventory daysDays in periodWorking capitalTrade payablesCash operating costs (positive)from statementsCreditor daysDays in period
24 parts, each one tested.
Every part is a tested building block with its own checks: yours is put together from the ones your business needs.
- CPI forecastConsensus curve with long-run anchor
- Exchange rate (US dollar)Exchange rate by financial year
- Revenue (top-down)Price × volume
- Direct costs (top-down)Gross margin %
- Corporate costsFixed cost base indexed to CPI
- Working capitalFull working capital
- Income taxCorporate rate with tax losses
- DebtAmortising term loan
- Equity raisingDistribution reinvestment plan
- Dividends and distributionsPayout of net profit
- Discounted cash flow valuationDCF on free cash flow to the firm
- Multiples valuationEV / EBITDA multiple
- Net asset valueBook net asset value
- Group unit costs (single-product portfolios)C1, C2 and C3 cost per poundGroup unit costs, realised prices and margins that investors use to compare miners. Only meaningful when every mine sells the same product.
- Key-metric summaryLast-twelve-month and run-rate metrics
- Covenant tests and headroomLVR, gearing and ICR for property
- Discount rate (WACC)CAPM at target gearing
- Mine registerMine register (ore reserves)The facts every other part of the model builds on — mineable inventory (reserves plus any converted resources), carrying value and mine life.
- Development and first productionMine already in productionPre-production construction capex, first production date and ramp-up to nameplate for new mines and expansions. Development capex feeds the asset base (and so PP&E and investing cash flow).
- Mining and processingMill throughput × grade × recovery (gold)The physical chain from ore and waste mined, through plant throughput, head grade and recovery, to payable product (in units of the mine's own product: ounces, tonnes, dry metric tonnes, pounds) and the reserves remaining.
- Sales and realised pricesPartly hedged gold sales (hedge book at a fixed price)Product sold × realised price, including hedging, offtake terms, quality adjustments and smelter charges. Units sold and prices are per unit of the mine's own product; the market price (spot, or FOB for bulk commodities) is the royalty value basis.
- RoyaltiesAd valorem royalty (% of value)Government royalties, third-party royalties and community payments on each mine's production.
- Site operating costsUnit rates (mining $/t, processing $/t, fixed site G&A)Mining, processing, site administration and (for bulk commodities) rail, port and shipping costs.
- Mine assets and depreciationUnits-of-production depreciation on ore reservesSustaining and growth capex (including capitalised stripping and underground development) and depreciation of mine properties and plant.
The numbers it tracks.
- 01attributable gold-equivalent ounces
- 02cash margin per ounce
- 03capital deployed
- 04P/NAV
- 05dividend yield
What it is used for.
- Operating forecastGuide · Financial projections
- ValuationGuide · DCF valuation model
- Equity capital raisingGuide · Startup financial model
- Lending and credit analysisGuide · Three-statement model
- Merger or acquisition (strategic)Guide · Financial modelling services
- Scenarios and sensitivities
- Asset acquisition
More in explorers, developers and royalties.
Looking for a mining royalty and streaming company financial model template? Ours arrives built for your business, with your figures in it.
See a finished model, sheet by sheetThe sample is built on illustrative figures and describes no real business. Models are calculations prepared from the information you provide. They are not financial advice and must be independently verified. See our terms.