Supermarket financial model, built free.
A three-statement Excel model for a supermarket and grocery chain, built from your own figures and checked to balance.
- Free account
- No card
- Usually ready within the hour
We use generative AI in parts of our process, so mistakes can occur. Every model should be checked by a person before it is relied on. Read more
Sells groceries, fresh food and liquor through supermarket formats plus an online home-delivery and click-and-collect channel, earning a thin gross margin on high volumes with negative working capital.
In short
- 01
Three linked statements
Income statement, balance sheet and cash flow, linked in every period.
- 02
Valued two ways
Discounted cash flow and trading multiples, side by side.
- 03
Monthly to annual
Monthly, quarterly, half-yearly or annual periods, for up to 30 years.
- 04
Checked every period
A Checks sheet shows the balance sheet balances and the cash reconciles.
The sample, as Excel draws it.
Built by the same system and checks as yours, on illustrative figures: every sheet as Excel draws it, or live.
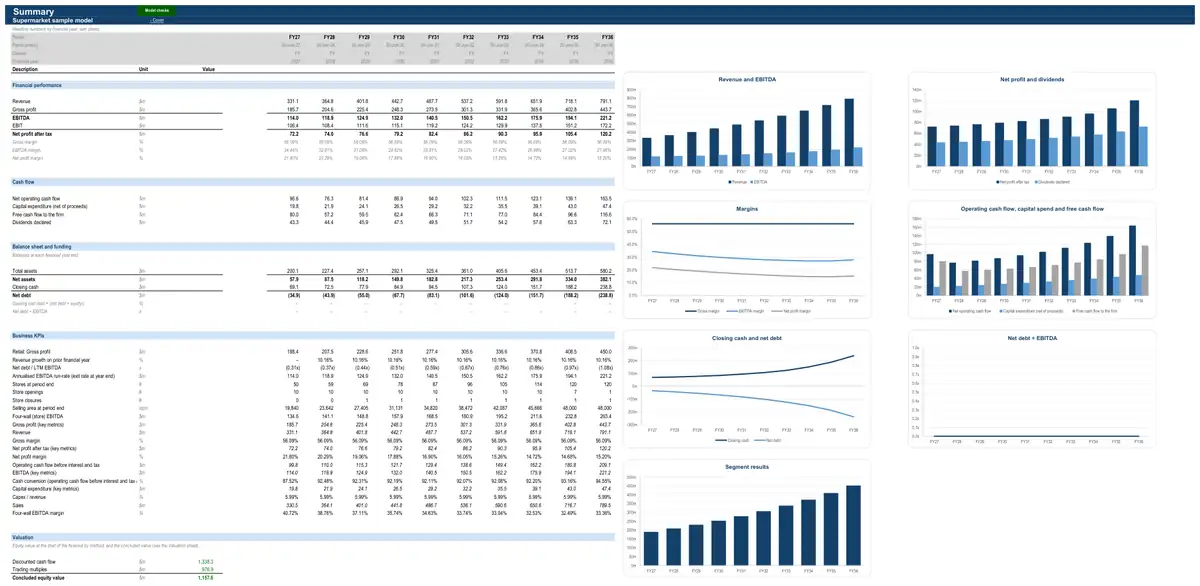
Illustrative figures: the sample describes no real business. The live preview shows values; your model’s Excel file has every formula.
How the model works for a supermarket.
- How it earns revenue3 formulasSales · All store formatsOnline salesOrdersAverage order valueConcessions, services and other retail income · All store formatsConcession, services and other retail incomeOnline salesfrom salesOther retail income (% of sales)Loyalty, gift cards and memberships · Across the businessLoyalty rewards deferred from revenueSalesfrom all unitsLoyalty reward cost (% of sales)
- What drives its costs3 formulasCost of goods sold · All store formatsCost of goods soldLanded cost of product soldShrinkageFreight and logisticsLess supplier rebatesStore and channel operating costs · All store formatsStore operating costsStore wagesRentOther store costsVariable store costsPre-opening costsMarketing and customer acquisition · All store formatsMarketing and customer acquisitionCustomer acquisition spendRetention marketing
- What it invests in3 formulasStore capex and depreciation · All store formatsCapital expenditureOnline salesfrom salesCapex as % of salesStore capex and depreciation · All store formatsLess depreciationDepreciation (run-off of a mix of vintages)DepreciationStore capex and depreciation · All store formatsClosing net book valueOpening net book valueAdd capital expenditureLess depreciation
- How it is funded3 formulasDebtRepaymentsScheduled repaymentsPrepayments from an equity raise and the cash sweepDebtClosing balanceOpening balanceDrawdownsRepaymentsDebtInterest expenseOpening balanceAll-in interest rateshare of the year
- How profit becomes cash3 formulasWorking capitalTrade receivablesRevenuefrom statementsDebtor daysDays in periodWorking capitalInventoryDirect costs (positive)from statementsInventory daysDays in periodWorking capitalTrade payablesCash operating costs (positive)from statementsCreditor daysDays in period
28 parts, each one tested.
Every part is a tested building block with its own checks: yours is put together from the ones your business needs.
- CPI forecastConsensus curve with long-run anchor
- Corporate costsFixed cost base indexed to CPI
- Working capitalFull working capital
- Income taxCorporate rate with tax losses
- Corporate fixed assetsStraight-line over remaining life
- DebtAmortising term loan
- Dividends and distributionsPayout of net profit
- Discounted cash flow valuationDCF on free cash flow to the firm
- Multiples valuationEV / EBITDA multiple
- LeasesLease register
- Key-metric summaryLast-twelve-month and run-rate metrics
- Budget phasingSeasonal profile of twelve monthly weights
- Covenant tests and headroomLVR, gearing and ICR for property
- Case selectionStackable stress toggles
- Discount rate (WACC)CAPM at target gearing
- Seasonal phasing of salesHistorical monthly profileHow annual sales — and the stock and cash that follow them — are spread across months or quarters.
- InventoryStock per store plus DC stockStock held in stores, distribution centres and in transit, and the cash it ties up.
- Distribution and logisticsLogistics % of salesDistribution-centre, warehousing and outbound freight costs of moving goods to stores, customers or retail accounts.
- Loyalty, gift cards and membershipsLoyalty cost % of salesCustomer programs that defer revenue — loyalty points, gift cards and paid memberships — and the liability they create.
- Store networkRoll-out to a target networkStores trading in each period — openings, closures and selling area — which every per-store driver multiplies.
- SalesOnline sales from active customers × orders × order valueSales of the format — stores, restaurants, cafés or an online channel — the revenue base of every retailer.
- Cost of goods soldProduct margin less shrinkage and freightCost of the goods (or food) sold by the format, after supplier terms, freight, markdowns and shrinkage.
- Store and channel operating costsPer-store wages, rent and other costsCosts of running the format — store wages, rent and occupancy, running costs, or an online channel's fulfilment and platform costs (rent here is the pre-AASB 16 cash view).
- Store capex and depreciationCapex as % of salesFit-out spend on new stores, refurbishments and maintenance, and the depreciation and book value of store assets.
- Like-for-like growth driverInflation plus volumeLike-for-like (comparable-store) growth built from its drivers — price, volume, traffic, ticket, macro.
- Marketing and customer acquisitionNew customers × CAC plus retentionSpend on acquiring and retaining customers — media, catalogues, paid search and social, affiliates and CRM.
- Concessions, services and other retail incomeOther income % of salesIncome earned alongside merchandise sales — concession commissions, extended warranties, consumer-finance commissions and delivery or installation services.
- Store and unit economicsNew-store investment and paybackFour-wall (store) profit and the return on each new store or restaurant — the unit economics that support a roll-out, a franchise system or an online channel; reporting only.
The numbers it tracks.
- 01sales per store
- 02LFL growth
- 03transactions and basket size
- 04gross margin %
- 05shrink % of sales
- 06CODB % of sales
- 07retail media income
- 08EBIT margin
- 09online penetration
- 10inventory and payable days
What it is used for.
- Operating forecastGuide · Financial projections
- Budget and rolling forecastGuide · Cash flow forecast
- ValuationGuide · DCF valuation model
- Lending and credit analysisGuide · Three-statement model
- Scenarios and sensitivities
More in shops and stores.
- Clothing retailer financial model
- Specialty retailer financial model
- Large-format retailer financial model
- Department store financial model
- Discount variety store financial model
- Warehouse club financial model
- Service station and convenience store financial model
- Liquor retailer financial model
- Hardware store financial model
- Pet store financial model
- Jewellery store financial model
- Optometry and eyewear store financial model
- Second-hand retailer financial model
- Duty-free retailer financial model
Looking for a supermarket financial model template? Ours arrives built for your business, with your figures in it.
Running a small business? Read what goes into a small business financial model.
See a finished model, sheet by sheetThe sample is built on illustrative figures and describes no real business. Models are calculations prepared from the information you provide. They are not financial advice and must be independently verified. See our terms.