Courier and delivery company financial model, built free.
A three-statement Excel model for a parcel, express and last-mile delivery operator, built from your own figures and checked to balance.
- Free account
- No card
- Usually ready within the hour
We use generative AI in parts of our process, so mistakes can occur. Every model should be checked by a person before it is relied on. Read more
Collects, sorts and delivers parcels and documents through hubs and depots with contractor last-mile drivers, earning per-parcel rates with surcharges; volumes follow online retail.
In short
- 01
Three linked statements
Income statement, balance sheet and cash flow, linked in every period.
- 02
Valued two ways
Discounted cash flow and trading multiples, side by side.
- 03
Monthly to annual
Monthly, quarterly, half-yearly or annual periods, for up to 30 years.
- 04
Checked every period
A Checks sheet shows the balance sheet balances and the cash reconciles.
The sample, as Excel draws it.
Built by the same system and checks as yours: its structure and its inputs, ready for your own figures.
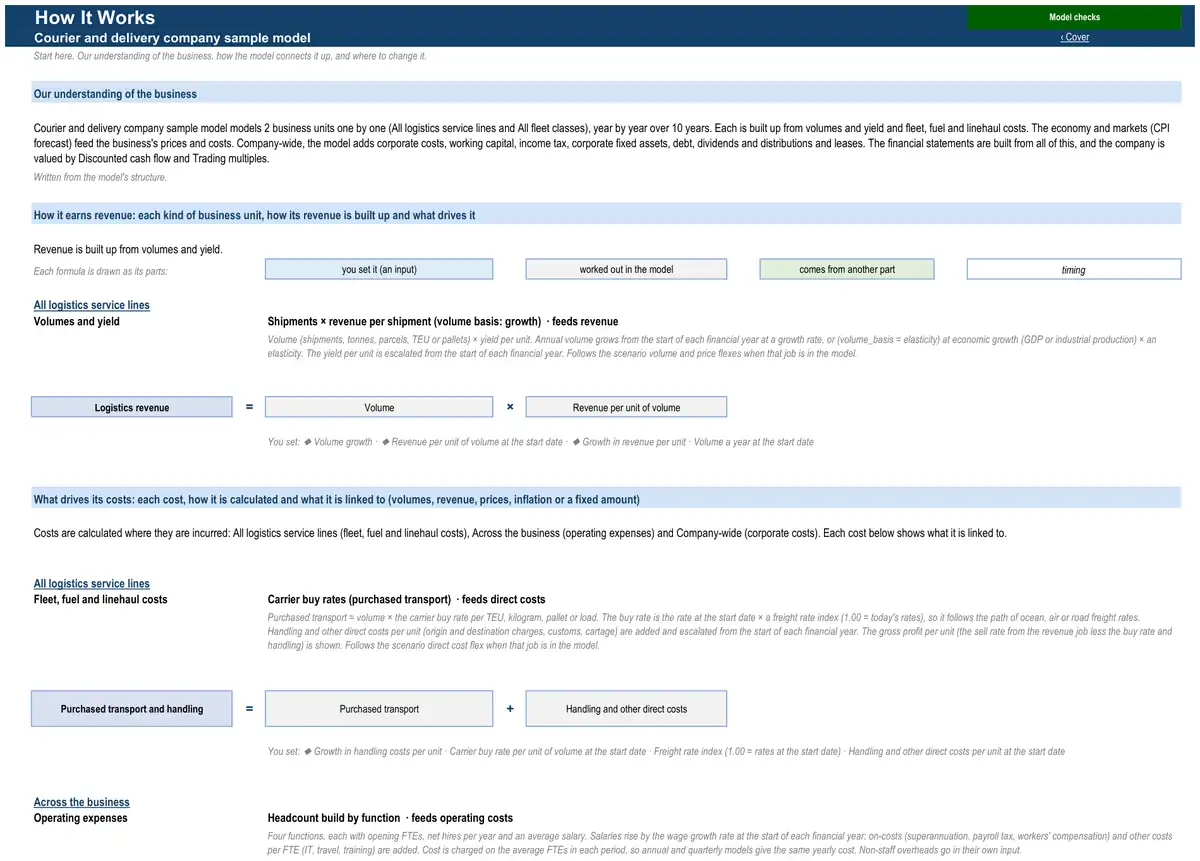
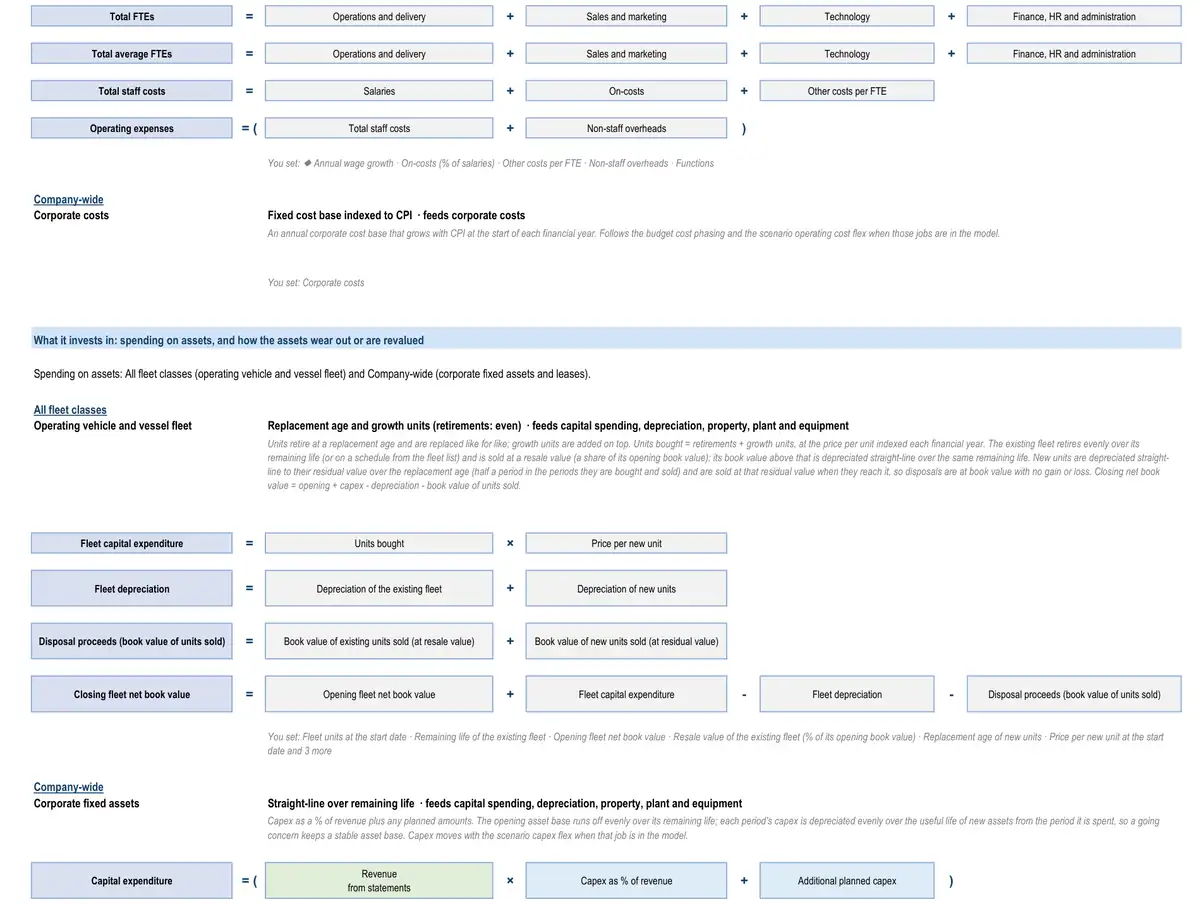
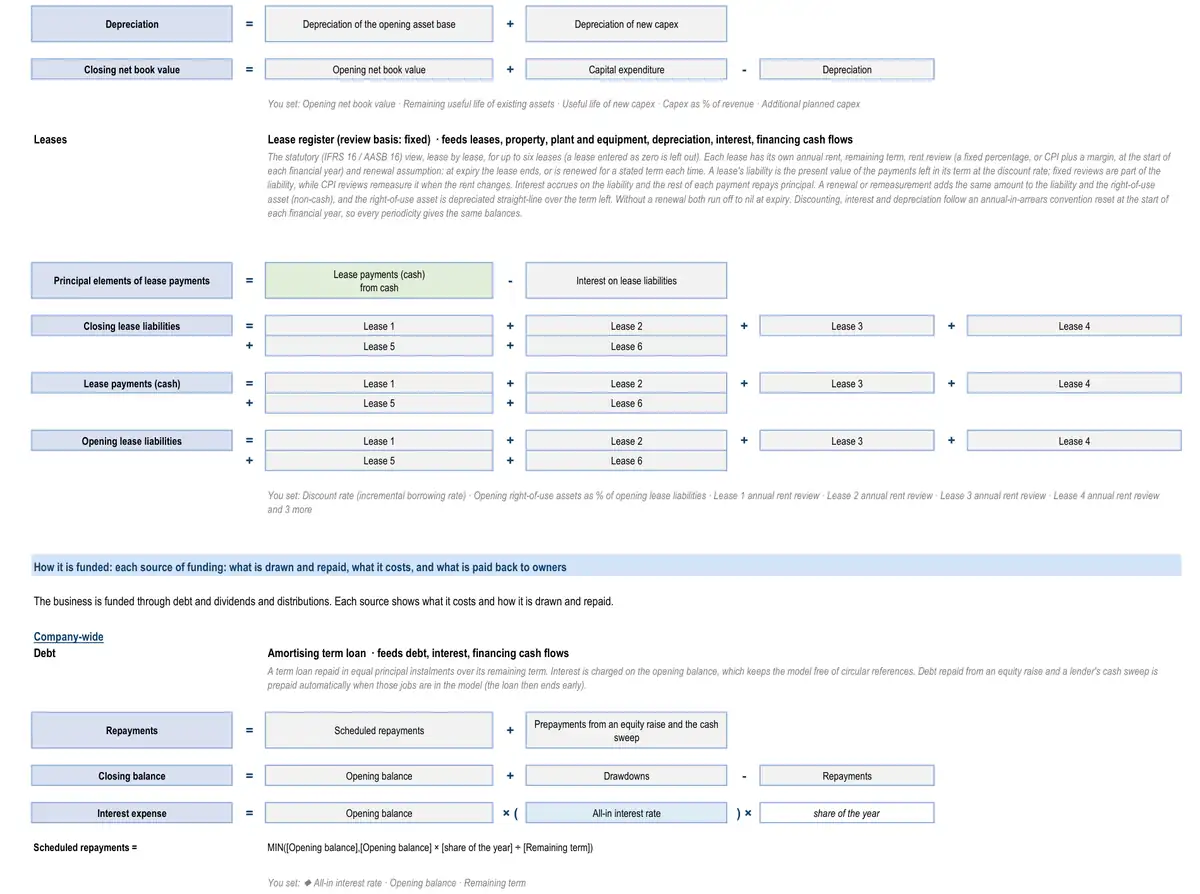
The sample describes no real business. Yours is calibrated to your own figures, so its results are your business’s.
How the model works for a courier and delivery company.
- How it earns revenue1 formulaVolumes and yield · All logistics service linesLogistics revenueVolumeRevenue per unit of volume
- What drives its costs3 formulasFleet, fuel and linehaul costs · All logistics service linesPurchased transport and handlingPurchased transportHandling and other direct costsOperating expenses · Across the businessTotal FTEsOperations and deliverySales and marketingTechnologyFinance, HR and administrationOperating expenses · Across the businessTotal average FTEsOperations and deliverySales and marketingTechnologyFinance, HR and administration
- What it invests in3 formulasOperating vehicle and vessel fleet · All fleet classesFleet capital expenditureUnits boughtPrice per new unitOperating vehicle and vessel fleet · All fleet classesFleet depreciationDepreciation of the existing fleetDepreciation of new unitsOperating vehicle and vessel fleet · All fleet classesDisposal proceeds (book value of units sold)Book value of existing units sold (at resale value)Book value of new units sold (at residual value)
- How it is funded3 formulasDebtRepaymentsScheduled repaymentsPrepayments from an equity raise and the cash sweepDebtClosing balanceOpening balanceDrawdownsRepaymentsDebtInterest expenseOpening balanceAll-in interest rateshare of the year
- How profit becomes cash3 formulasWorking capitalTrade receivablesRevenuefrom statementsDebtor daysDays in periodWorking capitalInventoryDirect costs (positive)from statementsInventory daysDays in periodWorking capitalTrade payablesCash operating costs (positive)from statementsCreditor daysDays in period
17 parts, each one tested.
Every part is a tested building block with its own checks: yours is put together from the ones your business needs.
- CPI forecastConsensus curve with long-run anchor
- Operating expensesHeadcount build by function
- Corporate costsFixed cost base indexed to CPI
- Working capitalFull working capital
- Income taxCorporate rate with tax losses
- Corporate fixed assetsStraight-line over remaining life
- DebtAmortising term loan
- Dividends and distributionsPayout of net profit
- Discounted cash flow valuationDCF on free cash flow to the firm
- Multiples valuationEV / EBITDA multiple
- LeasesLease register
- Key-metric summaryLast-twelve-month and run-rate metrics
- Discount rate (WACC)CAPM at target gearing
- Terminal valuePerpetuity growth on normalised cash flow
- Volumes and yieldShipments × revenue per shipmentShipments, tonnes, parcels or pallets handled by each service line and the revenue they earn.
- Fleet, fuel and linehaul costsCarrier buy rates (purchased transport)Drivers, fuel, fleet running costs, subcontractors and warehouse labour for each service line.
- Operating vehicle and vessel fleetReplacement age and growth unitsBuses, trucks, vans, ferries and ground-support equipment owned or leased by an operator — numbers, capex, depreciation, disposals and zero-emission transition.
The numbers it tracks.
- 01parcels
- 02revenue per parcel
- 03cost per parcel
- 04drops per route
- 05hub utilisation
- 06EBITDA margin
What it is used for.
- Operating forecastGuide · Financial projections
- Budget and rolling forecastGuide · Cash flow forecast
- ValuationGuide · DCF valuation model
- Lending and credit analysisGuide · Three-statement model
- Leveraged buyout (private equity)Guide · Financial modelling services
- Merger or acquisition (strategic)Guide · Financial modelling services
- Startup and venture fundingGuide · Startup financial model
More in logistics and freight.
- Logistics company financial model
- Trucking company financial model
- Freight forwarder financial model
- 3PL warehousing company financial model
- Cold-chain logistics company financial model
- Car-share and mobility fleet financial model
Looking for a courier and delivery company financial model template? Ours arrives built for your business, with your figures in it.
See a finished model, sheet by sheetThe sample is built on illustrative figures and describes no real business. Models are calculations prepared from the information you provide. They are not financial advice and must be independently verified. See our terms.