Cotton gin financial model, built free.
A three-statement Excel model for a cotton gin and marketer, built from your own figures and checked to balance.
- Free account
- No card
- Usually ready within the hour
We use generative AI in parts of our process, so mistakes can occur. Every model should be checked by a person before it is relied on. Read more
Gins growers' seed cotton into lint bales for a fee per bale (or buys and markets the lint), selling cottonseed and marketing lint to overseas spinning mills, with volumes swinging with irrigation water and the season.
In short
- 01
Three linked statements
Income statement, balance sheet and cash flow, linked in every period.
- 02
Valued two ways
Discounted cash flow and trading multiples, side by side.
- 03
Monthly to annual
Monthly, quarterly, half-yearly or annual periods, for up to 30 years.
- 04
Checked every period
A Checks sheet shows the balance sheet balances and the cash reconciles.
The sample, as Excel draws it.
Built by the same system and checks as yours: its structure and its inputs, ready for your own figures.
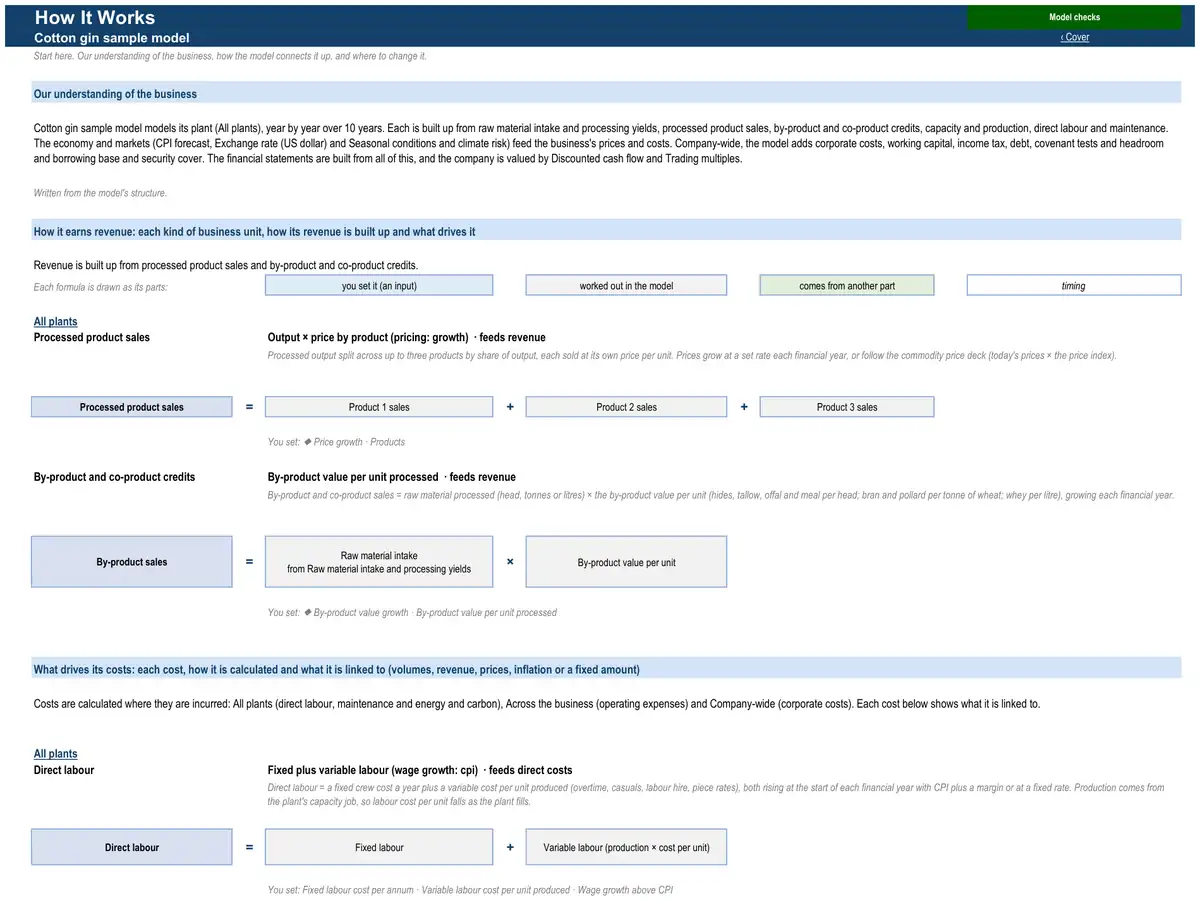
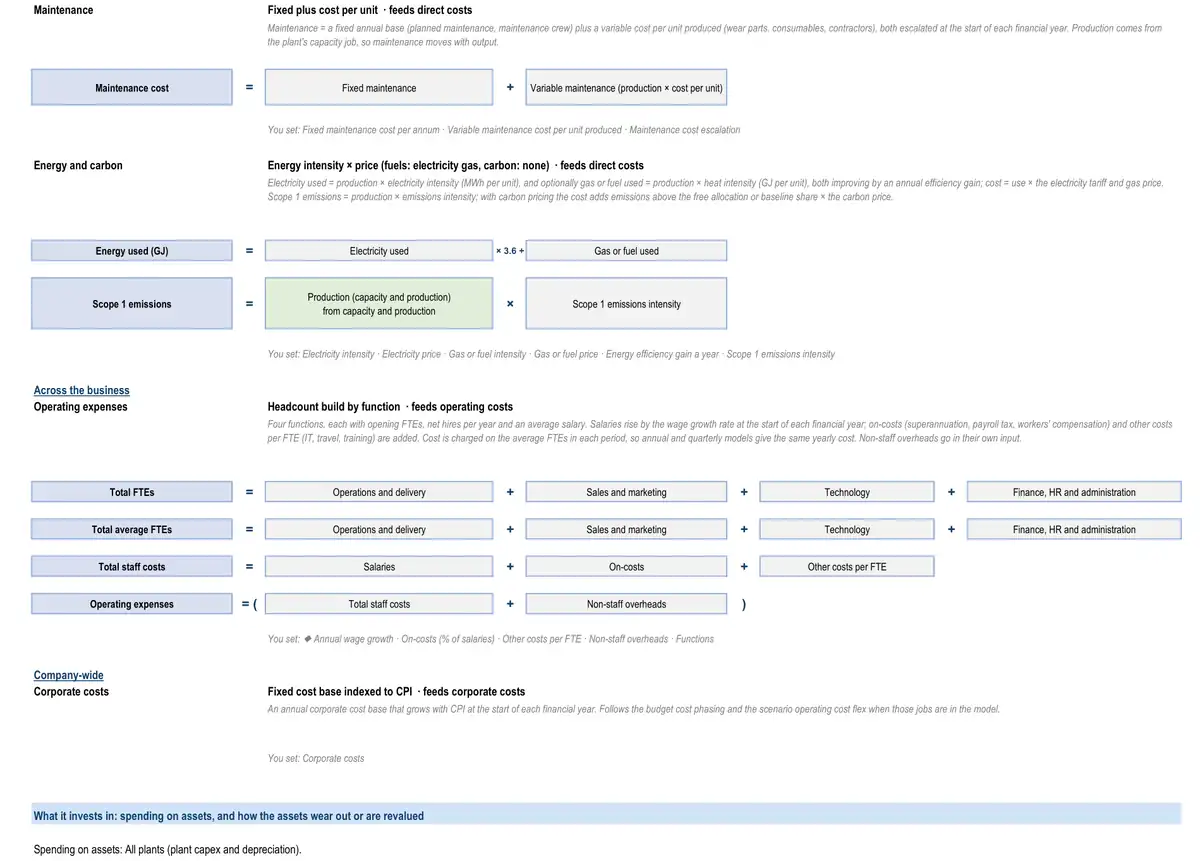
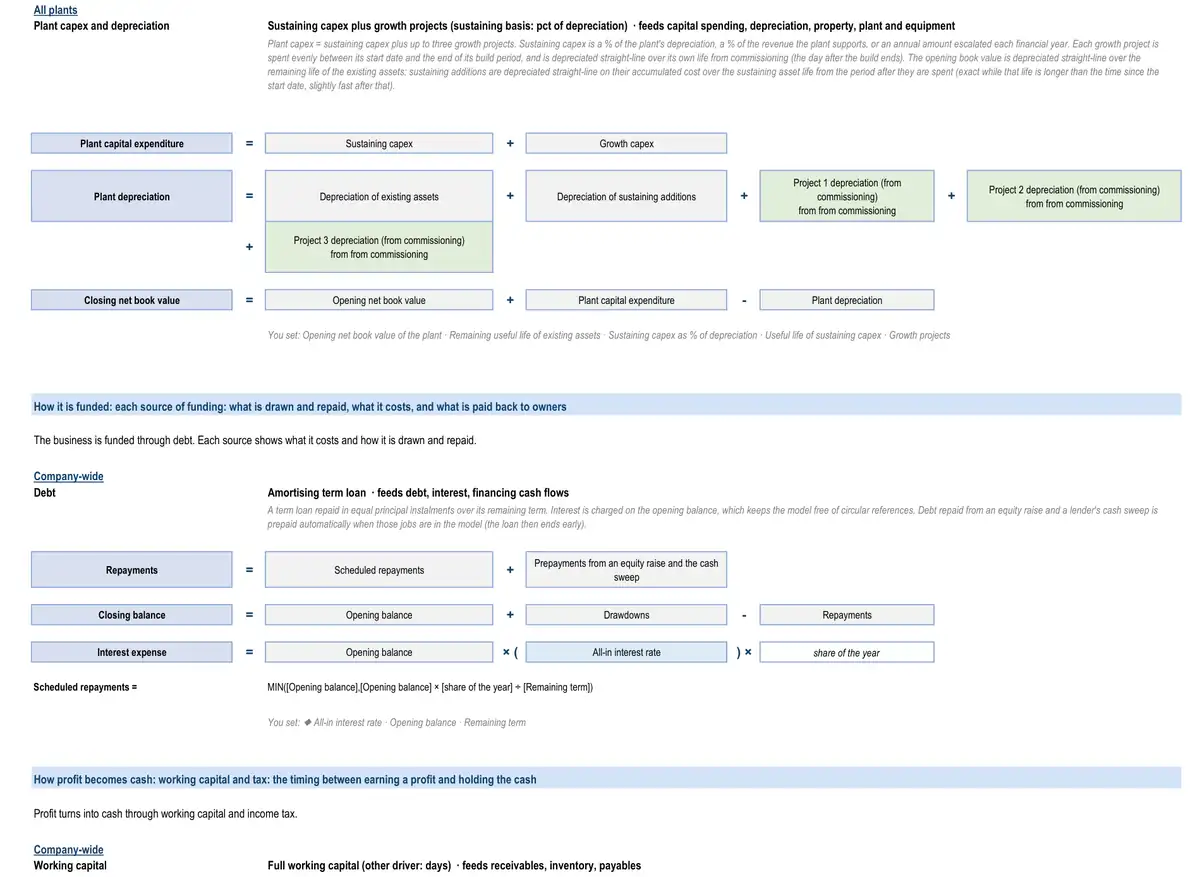
The sample describes no real business. Yours is calibrated to your own figures, so its results are your business’s.
How the model works for a cotton gin.
- How it earns revenue2 formulasProcessed product sales · All plantsProcessed product salesProduct 1 salesProduct 2 salesProduct 3 salesBy-product and co-product credits · All plantsBy-product salesRaw material intakefrom raw material intake and processing yieldsBy-product value per unit
- What drives its costs3 formulasDirect labour · All plantsDirect labourFixed labourVariable labour (production × cost per unit)Maintenance · All plantsMaintenance costFixed maintenanceVariable maintenance (production × cost per unit)Energy and carbon · All plantsEnergy used (GJ)Electricity usedGas or fuel used
- What it invests in3 formulasPlant capex and depreciation · All plantsPlant capital expenditureSustaining capexGrowth capexPlant capex and depreciation · All plantsPlant depreciationDepreciation of existing assetsDepreciation of sustaining additionsProject 1 depreciation (from commissioning)from from commissioningProject 2 depreciation (from commissioning)from from commissioningProject 3 depreciation (from commissioning)from from commissioningPlant capex and depreciation · All plantsClosing net book valueOpening net book valuePlant capital expenditurePlant depreciation
- How it is funded3 formulasDebtRepaymentsScheduled repaymentsPrepayments from an equity raise and the cash sweepDebtClosing balanceOpening balanceDrawdownsRepaymentsDebtInterest expenseOpening balanceAll-in interest rateshare of the year
- How profit becomes cash3 formulasWorking capitalTrade receivablesRevenuefrom statementsDebtor daysDays in periodWorking capitalInventoryDirect costs (positive)from statementsInventory daysDays in periodWorking capitalTrade payablesCash operating costs (positive)from statementsCreditor daysDays in period
21 parts, each one tested.
Every part is a tested building block with its own checks: yours is put together from the ones your business needs.
- CPI forecastConsensus curve with long-run anchor
- Exchange rate (US dollar)Exchange rate by financial year
- Operating expensesHeadcount build by function
- Corporate costsFixed cost base indexed to CPI
- Working capitalFull working capital
- Income taxCorporate rate with tax losses
- DebtAmortising term loan
- Discounted cash flow valuationDCF on free cash flow to the firm
- Multiples valuationEV / EBITDA multiple
- Seasonal conditions and climate riskSeason type by yearA season factor that scales yields, carrying capacity, receivals, input demand (or, for ski resorts, snow and skier visits) for drought, average and good years.
- Key-metric summaryLast-twelve-month and run-rate metrics
- Covenant tests and headroomLVR, gearing and ICR for property
- Borrowing base and security coverReceivables and inventory borrowing base
- Raw material intake and processing yieldsCapacity × utilisation × conversion yieldFarm or forest raw material received by a processing plant — head of livestock, litres of milk, tonnes of cane, grain or seed cotton, cubic metres of logs — and the products it yields.
- Processed product salesOutput × price by productSales of meat, dairy products, sugar, flour, malt, oils, lint, sawn timber, pulp and paper from a processing plant.
- By-product and co-product creditsBy-product value per unit processedRevenue from by-products of food processing — hides, tallow, meals and offal, whey, bran, pomace.
- Capacity and productionNameplate capacity × utilisation
- Direct labourFixed plus variable labour
- MaintenanceFixed plus cost per unit
- Plant capex and depreciationSustaining capex plus growth projects
- Energy and carbonEnergy intensity × price
The numbers it tracks.
- 01bales ginned
- 02ginning fee per bale
- 03lint turnout
- 04cottonseed sales
- 05marketing margin
- 06EBITDA
What it is used for.
More in food, drink and fibre processing.
- Food processor financial model
- Wine and beverage producer financial model
- Meat processor financial model
- Dairy processor financial model
- Sugar mill financial model
- Flour mill and maltster financial model
- Bakery manufacturer financial model
- Confectionery and snack manufacturer financial model
- Fertiliser manufacturer financial model
- Sawmill financial model
- Pulp and paper mill financial model
Looking for a cotton gin financial model template? Ours arrives built for your business, with your figures in it.
See a finished model, sheet by sheetThe sample is built on illustrative figures and describes no real business. Models are calculations prepared from the information you provide. They are not financial advice and must be independently verified. See our terms.