Electricity network financial model, built free.
A three-statement Excel model for an electricity transmission or distribution network, built from your own figures and checked to balance.
- Free account
- No card
- Usually ready within the hour
We use generative AI in parts of our process, so mistakes can occur. Every model should be checked by a person before it is relied on. Read more
Owns poles, wires and substations and earns a regulated revenue set by the regulator from its regulated asset base, allowed return, depreciation and operating allowance.
In short
- 01
Three linked statements
Income statement, balance sheet and cash flow, linked in every period.
- 02
Valued two ways
Discounted cash flow and trading multiples, side by side.
- 03
Monthly to annual
Monthly, quarterly, half-yearly or annual periods, for up to 30 years.
- 04
Checked every period
A Checks sheet shows the balance sheet balances and the cash reconciles.
The sample, as Excel draws it.
Built by the same system and checks as yours, on illustrative figures: every sheet as Excel draws it, or live.
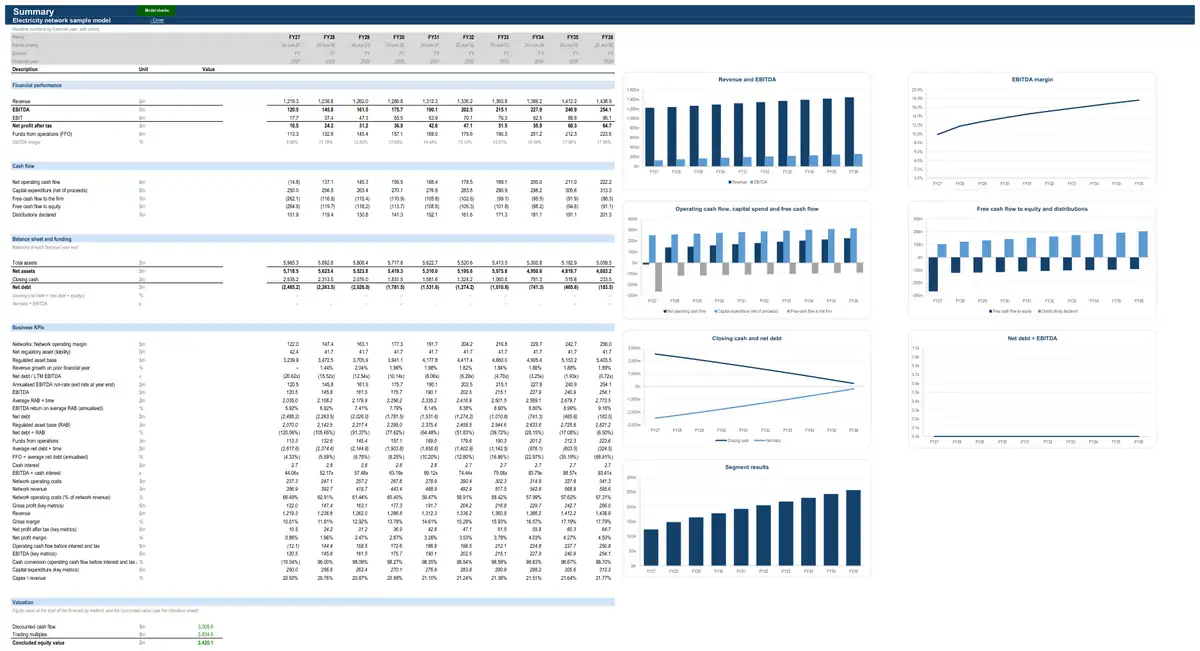
Illustrative figures: the sample describes no real business. The live preview shows values; your model’s Excel file has every formula.
How the model works for an electricity network.
- How it earns revenue3 formulasRegulatory assets and liabilities · All network assetsClosing deferred fuel balanceOpening deferred fuel balanceCosts deferred (under-recovery less over-recovery)Carrying charge accruedTrue-up surcharge (refund) recovering the balanceRegulatory assets and liabilities · All network assetsFuel and purchased-energy recoveries billedFuel cost recovered through the factor in ratesTrue-up surcharge (refund) recovering the balanceRegulatory assets and liabilities · All network assetsFuel and purchased-energy costs (actual, less deferral, plus amortisation)Actual fuel and purchased-energy costsCosts deferred (under-recovery less over-recovery)True-up surcharge (refund) recovering the balance
- What drives its costs1 formulaNetwork operating costs · All network assetsNetwork operating costsCustomer-driven costsNetwork length-driven costs
- What it invests in3 formulasCapital programme and statutory depreciation · All network assetsNetwork capexCapex allowance (nominal)Delivery of the capex allowanceCapital programme and statutory depreciation · All network assetsNetwork depreciationDepreciation of the opening asset baseDepreciation of new capex (half-year convention)Capital programme and statutory depreciation · All network assetsClosing net book valueOpening net book valueNetwork capexNetwork depreciation
- How it is funded3 formulasDebtClosing balanceOpening balanceDrawdownsRepaymentsDebtInterest expenseOpening balanceAll-in interest rateshare of the yearDividends and distributionsClosing distributions payableOpening distributions payableDistributions declaredDistributions paid
- How profit becomes cash3 formulasWorking capitalTrade receivablesRevenuefrom statementsDebtor daysDays in periodWorking capitalInventoryDirect costs (positive)from statementsInventory daysDays in periodWorking capitalTrade payablesCash operating costs (positive)from statementsCreditor daysDays in period
19 parts, each one tested.
Every part is a tested building block with its own checks: yours is put together from the ones your business needs.
- CPI forecastConsensus curve with long-run anchor
- Corporate costsFixed cost base indexed to CPI
- Working capitalDays-based working capital
- Income taxCorporate rate with tax losses
- DebtSingle debt facility
- Dividends and distributionsPayout of FFO
- Discounted cash flow valuationDCF on free cash flow to the firm
- Multiples valuationEV / EBITDA multiple
- Energy and utility KPIsRegulated network metricsThe ratios investors and lenders use to judge energy and utility businesses.
- Interest-rate hedgingHedged share at a fixed rate
- Key-metric summaryLast-twelve-month and run-rate metrics
- Covenant tests and headroomLVR, gearing and ICR for property
- Discount rate (WACC)CAPM at target gearing
- Interest-rate forecastMarket forward curve
- Regulatory assets and liabilitiesDeferred fuel and purchased-power balanceBalances owed to or by customers under regulation — revenue unders and overs, deferred fuel and purchased-power costs, securitised costs — and their recovery through future tariffs.
- Regulated asset baseCPI-indexed roll-forwardRoll-forward of the regulated asset base that sets allowed returns — capex in, regulatory depreciation out, indexation.
- Network revenueBuilding blockRegulated or contracted revenue earned by the network, including incentive outcomes and unders and overs.
- Network operating costsPer customer and per kmOperating and maintenance costs of the network, including bulk water purchases for water utilities.
- Capital programme and statutory depreciationCapex allowance, straight-lineNetwork capex (replacement, augmentation, connections) net of contributions, and statutory depreciation of the network's plant.
The numbers it tracks.
- 01RAB growth
- 02return on RAB
- 03net debt / RAB
- 04FFO / net debt
- 05EV / RAB
- 06distribution yield
What it is used for.
- Operating forecastGuide · Financial projections
- Budget and rolling forecastGuide · Cash flow forecast
- ValuationGuide · DCF valuation model
- Lending and credit analysisGuide · Three-statement model
- Merger or acquisition (strategic)Guide · Financial modelling services
- Scenarios and sensitivities
- Asset acquisition
More in networks and utilities.
- Gas network financial model
- Water and sewerage utility financial model
- District heating and cooling network financial model
- Regulated utility financial model
- Multi-utility financial model
Looking for an electricity network financial model template? Ours arrives built for your business, with your figures in it.
See a finished model, sheet by sheetThe sample is built on illustrative figures and describes no real business. Models are calculations prepared from the information you provide. They are not financial advice and must be independently verified. See our terms.