Multi-utility financial model, built free.
A three-statement Excel model for a multi-utility, built from your own figures and checked to balance.
- Free account
- No card
- Usually ready within the hour
We use generative AI in parts of our process, so mistakes can occur. Every model should be checked by a person before it is relied on. Read more
Runs several utility businesses — electricity, gas, water, district heating, waste — across regulated networks and competitive generation and retail, reported by segment and often valued as a sum of the parts.
In short
- 01
Three linked statements
Income statement, balance sheet and cash flow, linked in every period.
- 02
Valued two ways
Discounted cash flow and sum of the parts, side by side.
- 03
Monthly to annual
Monthly, quarterly, half-yearly or annual periods, for up to 30 years.
- 04
Checked every period
A Checks sheet shows the balance sheet balances and the cash reconciles.
The sample, as Excel draws it.
Built by the same system and checks as yours, on illustrative figures: every sheet as Excel draws it, or live.
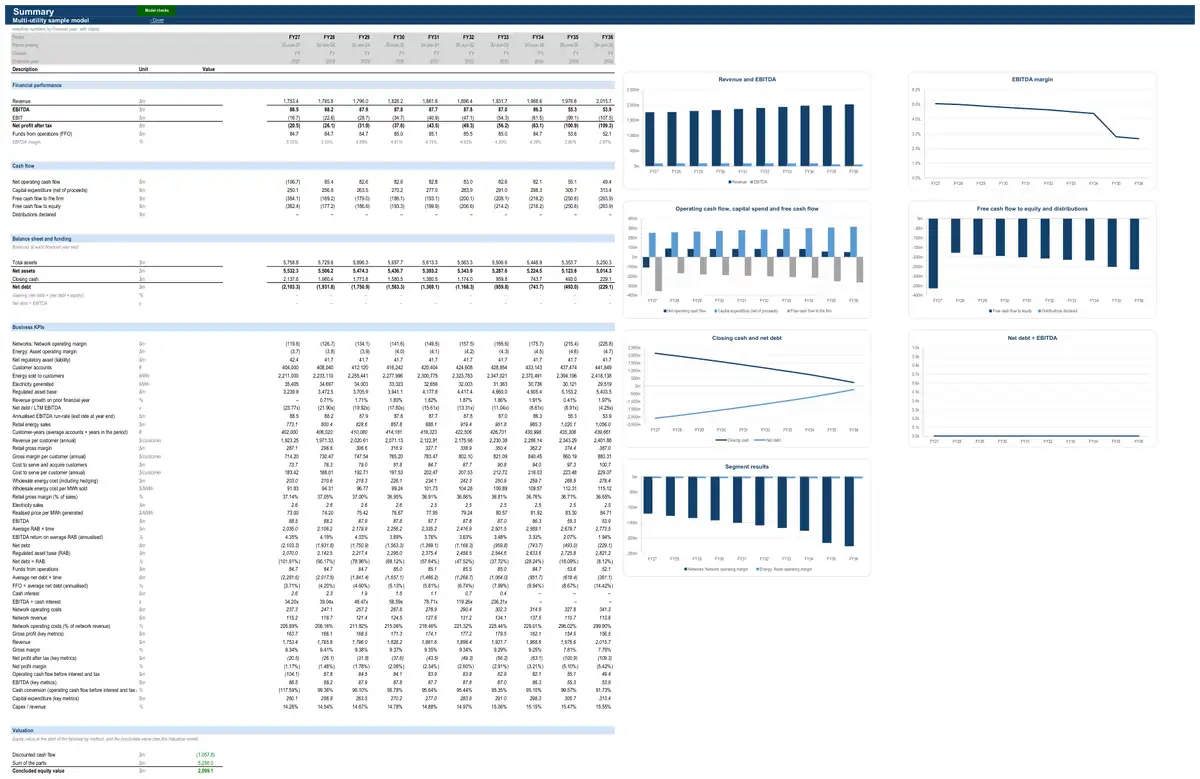
Illustrative figures: the sample describes no real business. The live preview shows values; your model’s Excel file has every formula.
How the model works for a multi-utility.
- How it earns revenue3 formulasEnergy revenue · All energy assetsElectricity salesPPA revenueMerchant revenueRegulatory assets and liabilities · All network assetsClosing deferred fuel balanceOpening deferred fuel balanceCosts deferred (under-recovery less over-recovery)Carrying charge accruedTrue-up surcharge (refund) recovering the balanceRegulatory assets and liabilities · All network assetsFuel and purchased-energy recoveries billedFuel cost recovered through the factor in ratesTrue-up surcharge (refund) recovering the balance
- What drives its costs3 formulasOperating costs · All energy assetsOperating costsO&M contractAsset managementLand leaseInsuranceGrid (TUOS) and connection chargesCommunity fundFuel, charging energy and carbon costs · All energy assetsCharging energy costEnergy chargedCharge (off-peak) priceNetwork charge on energy chargedNetwork operating costs · All network assetsNetwork operating costsCustomer-driven costsNetwork length-driven costs
- What it invests in3 formulasAsset base and depreciation · All energy assetsCapital expenditureConstruction capexSustaining capexAsset base and depreciation · All energy assetsDepreciationOpening net book valueCapital expenditureShare of the period in operationshare of the yearRemaining life at period startAsset base and depreciation · All energy assetsClosing net book valueOpening net book valueCapital expenditureDepreciation
- How it is funded3 formulasDebtRepaymentsScheduled repaymentsPrepayments from an equity raise and the cash sweepDebtClosing balanceOpening balanceDrawdownsRepaymentsDebtInterest expenseOpening balanceAll-in interest rateshare of the year
- How profit becomes cash3 formulasWorking capitalTrade receivablesRevenuefrom statementsDebtor daysDays in periodWorking capitalInventoryDirect costs (positive)from statementsInventory daysDays in periodWorking capitalTrade payablesCash operating costs (positive)from statementsCreditor daysDays in period
32 parts, each one tested.
Every part is a tested building block with its own checks: yours is put together from the ones your business needs.
- CPI forecastConsensus curve with long-run anchor
- Corporate costsFixed cost base indexed to CPI
- Working capitalFull working capital
- Income taxCorporate rate with tax losses
- DebtAmortising term loan
- Equity raisingDistribution reinvestment plan
- Dividends and distributionsPayout of net profit
- Discounted cash flow valuationDCF on free cash flow to the firm
- Retail energy revenueConsumption × tariffCustomer accounts, energy sold and retail revenue by segment.
- Wholesale, network and scheme costsInternal transfer from own generationCost of the energy sold to customers — wholesale energy and hedging, network charges and environmental scheme costs.
- Cost to serve and acquireAcquisition, retention and serviceRetail operating costs — billing, call centres, bad debts, marketing and customer acquisition.
- Wholesale electricity price curveAdviser price curveThe wholesale electricity price forecast used by the revenue and cost parts that need it.
- Decommissioning and restoration provisionsPresent value with accretionProvisions to remove generation assets, abandon wells and restore sites — recognition, unwinding and spend.
- Energy and utility KPIsRegulated network metricsThe ratios investors and lenders use to judge energy and utility businesses.
- Interest-rate hedgingHedged share at a fixed rate
- Key-metric summaryLast-twelve-month and run-rate metrics
- Covenant tests and headroomLVR, gearing and ICR for property
- Discount rate (WACC)CAPM at target gearing
- Sum of the partsRegister of parts on mixed bases
- Interest-rate forecastMarket forward curve
- Enterprise value to equity bridgeNet debt at the valuation date
- Asset registerEnergy asset registerThe facts every other part of the model builds on — capacity, opening book value and remaining life.
- GenerationStorage cycles and state of healthElectricity sent out (or discharged) by each asset in each period.
- Energy revenuePPA with merchant tailRevenue from selling electricity (or discharging storage) under contracts and in the wholesale market.
- Operating costsCost lines with escalationSite operating costs — O&M, asset management, land lease, insurance, grid charges and community payments.
- Asset base and depreciationStraight-line depreciation over remaining lifeSustaining and replacement capex and depreciation of each asset's property, plant and equipment.
- Fuel, charging energy and carbon costsCharging or pumping energyVariable cost of the energy an asset consumes — gas, coal, charging or pumping electricity, electrolyser power — and its carbon cost.
- Regulatory assets and liabilitiesDeferred fuel and purchased-power balanceBalances owed to or by customers under regulation — revenue unders and overs, deferred fuel and purchased-power costs, securitised costs — and their recovery through future tariffs.
- Regulated asset baseCPI-indexed roll-forwardRoll-forward of the regulated asset base that sets allowed returns — capex in, regulatory depreciation out, indexation.
- Network revenueContracted firm capacityRegulated or contracted revenue earned by the network, including incentive outcomes and unders and overs.
- Network operating costsPer customer and per kmOperating and maintenance costs of the network, including bulk water purchases for water utilities.
- Capital programme and statutory depreciationCapex allowance, straight-lineNetwork capex (replacement, augmentation, connections) net of contributions, and statutory depreciation of the network's plant.
The numbers it tracks.
- 01segment EBITDA (regulated versus competitive)
- 02RAB
- 03generation and retail volumes
- 04net debt / RAB
- 05EPS
- 06dividend
What it is used for.
- Operating forecastGuide · Financial projections
- Budget and rolling forecastGuide · Cash flow forecast
- ValuationGuide · DCF valuation model
- Lending and credit analysisGuide · Three-statement model
- Equity capital raisingGuide · Startup financial model
- Merger or acquisition (strategic)Guide · Financial modelling services
- Scenarios and sensitivities
More in networks and utilities.
- Electricity network financial model
- Gas network financial model
- Water and sewerage utility financial model
- District heating and cooling network financial model
- Regulated utility financial model
Looking for a multi-utility financial model template? Ours arrives built for your business, with your figures in it.
See a finished model, sheet by sheetThe sample is built on illustrative figures and describes no real business. Models are calculations prepared from the information you provide. They are not financial advice and must be independently verified. See our terms.