Casino resort financial model, built free.
A three-statement Excel model for a casino and integrated resort, built from your own figures and checked to balance.
- Free account
- No card
- Usually ready within the hour
We use generative AI in parts of our process, so mistakes can occur. Every model should be checked by a person before it is relied on. Read more
Operates licensed casinos — table games, gaming machines and premium play — usually alongside hotels, restaurants and entertainment, paying casino taxes and holding patron balances.
In short
- 01
Three linked statements
Income statement, balance sheet and cash flow, linked in every period.
- 02
Valued two ways
Discounted cash flow and trading multiples, side by side.
- 03
Monthly to annual
Monthly, quarterly, half-yearly or annual periods, for up to 30 years.
- 04
Checked every period
A Checks sheet shows the balance sheet balances and the cash reconciles.
The sample, as Excel draws it.
Built by the same system and checks as yours, on illustrative figures: every sheet as Excel draws it, or live.
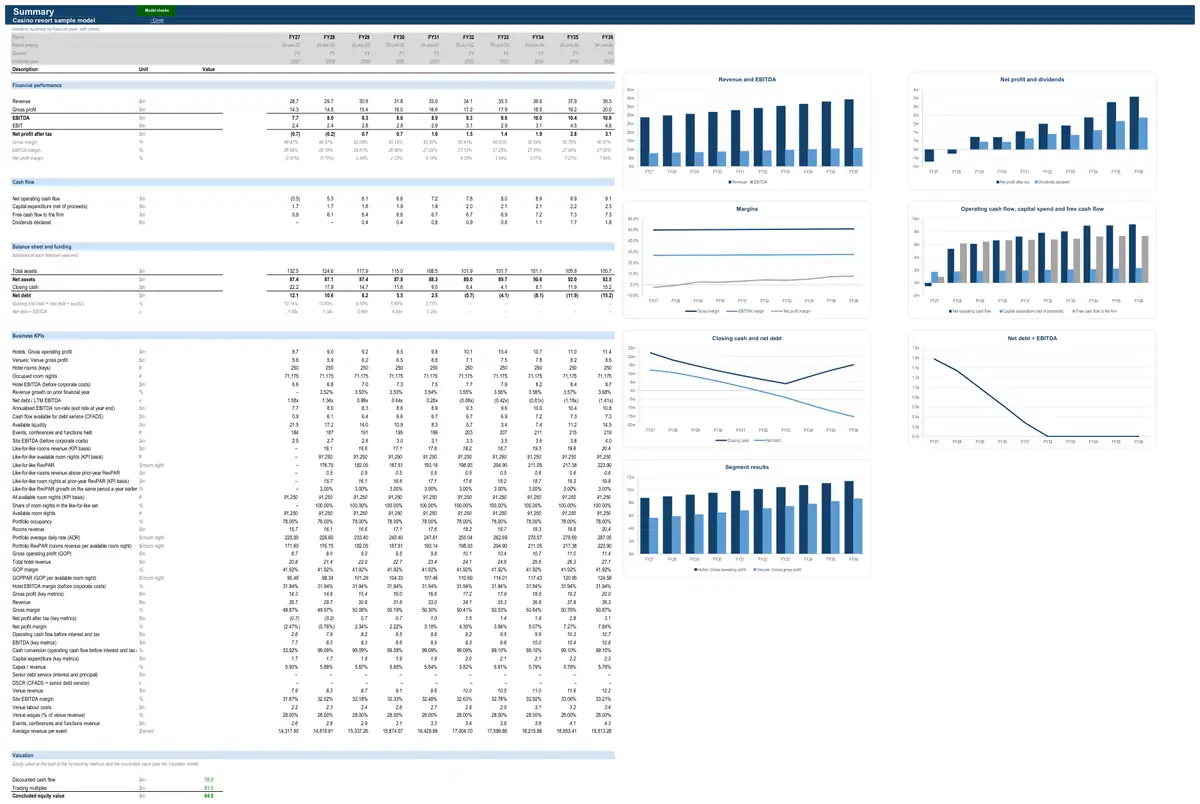
Illustrative figures: the sample describes no real business. The live preview shows values; your model’s Excel file has every formula.
How the model works for a casino resort.
- How it earns revenue3 formulasRooms revenue · All hotelsRooms revenueOccupied room nightsHotel average daily rate (ADR)Rooms revenue · All hotelsOccupied room nightsAvailable room nightsHotel occupancyFood, beverage and other revenue · All hotelsFood and beverage revenueF&B revenue from in-house guestsNon-resident F&B and events revenue
- What drives its costs3 formulasManagement and franchise fees · All hotelsFranchise feesFranchise royaltyMarketing, reservations and loyalty feesF&B royaltyDepartmental and undistributed costs · All hotelsDepartmental expensesRooms department expensesFood and beverage department expensesOther departments expensesDepartmental and undistributed costs · All hotelsUndistributed operating expensesFixed undistributed expensesVariable undistributed expenses
- What it invests in3 formulasFF&E, refurbishment and depreciation · All hotelsFF&E and refurbishment capexFF&E reserveScheduled refurbishment and major capexFF&E, refurbishment and depreciation · All hotelsDepreciationDepreciation of building and existing fit-outDepreciation of additionsFF&E, refurbishment and depreciation · All hotelsClosing net book valueOpening net book valueFF&E and refurbishment capexDepreciation
- How it is funded3 formulasDebtRepaymentsScheduled repaymentsPrepayments from an equity raise and the cash sweepDebtClosing balanceOpening balanceDrawdownsRepaymentsDebtInterest expenseOpening balanceAll-in interest rateshare of the year
- How profit becomes cash3 formulasWorking capitalTrade receivablesRevenuefrom statementsDebtor daysDays in periodWorking capitalInventoryDirect costs (positive)from statementsInventory daysDays in periodWorking capitalTrade payablesCash operating costs (positive)from statementsCreditor daysDays in period
44 parts, each one tested.
Every part is a tested building block with its own checks: yours is put together from the ones your business needs.
- CPI forecastConsensus curve with long-run anchor
- Exchange rate (US dollar)Exchange rate by financial year
- Corporate costsFixed cost base indexed to CPI
- Working capitalFull working capital
- Income taxCorporate rate with tax losses
- Corporate fixed assetsStraight-line over remaining life
- DebtAmortising term loan
- Equity raisingDistribution reinvestment plan
- Dividends and distributionsPayout of net profit
- Discounted cash flow valuationDCF on free cash flow to the firm
- Multiples valuationEV / EBITDA multiple
- Interest-rate hedgingHedged share at a fixed rate
- Portfolio KPIs (per key, like-for-like)Like-for-like RevPAR growthPortfolio ratios computed from summed room nights and revenue (never by adding hotel ratios).
- LeasesLease register
- Key-metric summaryLast-twelve-month and run-rate metrics
- Covenant tests and headroomLVR, gearing and ICR for property
- Feasibility metricsCash-flow returns
- Debt sizing and sculptingLower of DSCR capacity and maximum gearing
- Liquidity runway and funding needHeadroom, runway and funding need
- Case selectionStackable stress toggles
- Discount rate (WACC)CAPM at target gearing
- Customer deposits, deferred revenue and loyaltyDeferred revenue as days of revenueMoney customers pay before they are served — travel and event deposits, advance tickets, gift cards, prepaid memberships — plus loyalty points, patron deposits and gaming jackpots owed to customers.
- Completed valueCapitalised income
- Cash flow available for debt service (CFADS)From free cash flow to the firm
- Project timeline and phasesKey dates and durations
- Senior project debtSculpted repayment
- Tax depreciationTax life equal to book life
- Construction funding and drawdownPro rata at the target gearing
- Hotel registerRoom inventory changes by yearRooms (keys), opening book value and remaining life for each hotel.
- SeasonalityMonthly seasonal profileIndices that shape occupancy and ADR through the year in monthly or quarterly models.
- Rooms revenueCompetitive set penetration (MPI × ARI)Room nights available and sold, and rooms revenue at the average daily rate.
- Food, beverage and other revenueSpend per occupied room plus non-resident F&BRestaurants, bars, banqueting, conferences, spa, parking and other operated departments.
- Departmental and undistributed costsDepartmental cost ratios plus fixed undistributed costsDepartmental expenses (rooms, food and beverage, other), undistributed operating expenses (administration, sales and marketing, maintenance, utilities) and fixed charges (property taxes, insurance).
- Management and franchise feesFranchise fees (% of rooms revenue)What the hotel owner pays a brand or operator — management fees, franchise fees or variable lease rent.
- Hotel operating profitUSALI summary (GOP and hotel EBITDA)Total revenue, gross operating profit and hotel EBITDA in USALI summary form.
- FF&E, refurbishment and depreciationFF&E reserve plus scheduled refurbishmentCapex on furniture, fixtures and equipment and refurbishments, and the hotel's net book value and depreciation.
- Like-for-like comparabilityLike-for-like comparability from trading status
- Venue registerOpening date, closing date and capacityWhen each venue trades and its capacity — the facts the venue revenue and cost parts build on.
- Food, beverage and secondary spend revenueCovers × average spend per headBar, food, function, concessions and merchandise sales at the venue.
- Cost of goods sold and content costsMargin by revenue streamCost of food, beverage and merchandise sold, and content costs such as film hire paid on box office.
- Venue labour costsWages as % of revenueWages, salaries and on-costs of venue staff.
- Other venue operating costsCost lines with growthUtilities, repairs, marketing, security, cleaning, entertainment, licences and other site costs.
- Venue revenue and site EBITDA
- Events, conferences and functionsEvents × hire fee plus catering per guestSpace hire, conference delegate packages, weddings and functions, premium seating and naming rights sold by a venue, with deposits received ahead of the event.
The numbers it tracks.
- 01gross and net gaming revenue
- 02table hold
- 03machine win per day
- 04gaming tax rate
- 05EBITDA margin
What it is used for.
- Operating forecastGuide · Financial projections
- ValuationGuide · DCF valuation model
- Lending and credit analysisGuide · Three-statement model
- Development feasibilityGuide · Financial modelling services
- Project financeGuide · Financial modelling services
- Restructuring and liquidityGuide · Financial modelling services
- Scenarios and sensitivities
More in gaming and wagering.
- Online betting company financial model
- Lottery operator financial model
- Gaming technology supplier financial model
Looking for a casino resort financial model template? Ours arrives built for your business, with your figures in it.
Running a small business? Read what goes into a small business financial model.
See a finished model, sheet by sheetThe sample is built on illustrative figures and describes no real business. Models are calculations prepared from the information you provide. They are not financial advice and must be independently verified. See our terms.