Marina financial model, built free.
A three-statement Excel model for a marina operator, built from your own figures and checked to balance.
- Free account
- No card
- Usually ready within the hour
We use generative AI in parts of our process, so mistakes can occur. Every model should be checked by a person before it is relied on. Read more
Owns or leases marinas licensing wet berths, swing moorings and dry-stack racks on annual and casual terms, selling long-term berth licences in new developments, and earning boatyard, fuel, hardstand and dining income.
In short
- 01
Three linked statements
Income statement, balance sheet and cash flow, linked in every period.
- 02
Valued three ways
Discounted cash flow, trading multiples and net asset value, side by side.
- 03
Monthly to annual
Monthly, quarterly, half-yearly or annual periods, for up to 30 years.
- 04
Checked every period
A Checks sheet shows the balance sheet balances and the cash reconciles.
The sample, as Excel draws it.
Built by the same system and checks as yours, on illustrative figures: every sheet as Excel draws it, or live.
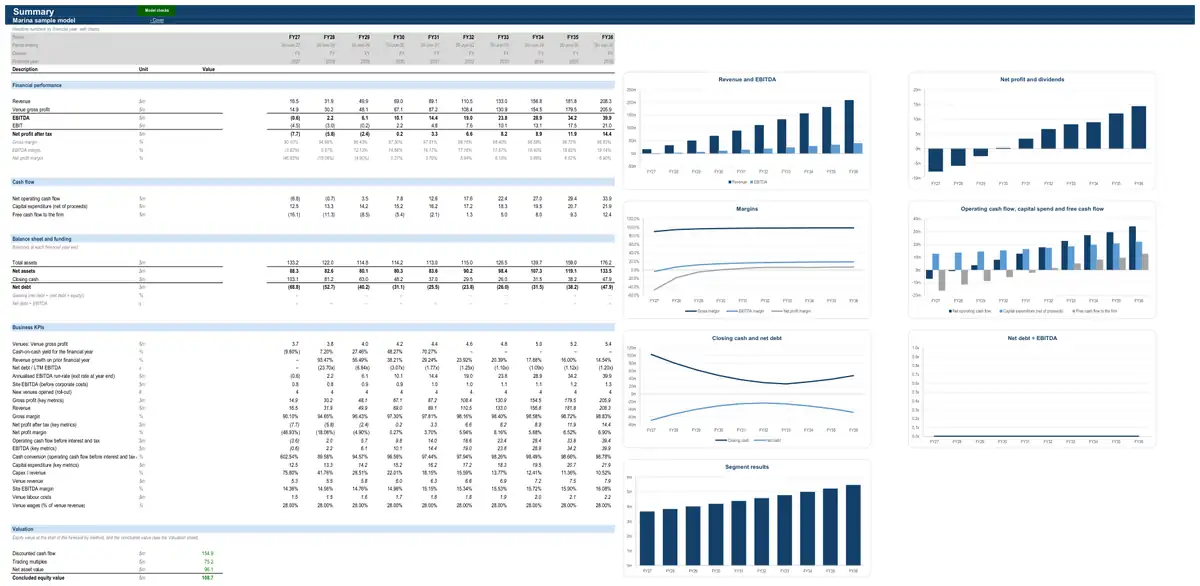
Illustrative figures: the sample describes no real business. The live preview shows values; your model’s Excel file has every formula.
How the model works for a marina.
- How it earns revenue3 formulasFood, beverage and secondary spend revenue · All venuesTotal coversDaytime coversEvening coversFood, beverage and secondary spend revenue · All venuesFood, beverage and secondary spend revenueDaytime salesEvening salesNew venues, acquisitions and refurbishments (top-down) · Across the businessRevenue from new venuesMature-venue equivalents (revenue)Mature revenue per venue (annual)share of the year
- What drives its costs3 formulasCost of goods sold and content costs · All venuesCost of goods sold and content costsBeverage cost of salesFood cost of salesMerchandise cost of salesContent costs on admissionsVenue labour costs · All venuesVenue labour costsVenue revenuefrom venue revenue and site EBITDAVenue labour (% of venue revenue)Venue rent and occupancy costs · All venuesVenue rent and occupancy costsBase rentTurnover rentOutgoings
- What it invests in3 formulasCorporate fixed assetsCapital expenditureRevenuefrom statementsCapex as % of revenueAdditional planned capexCorporate fixed assetsDepreciationDepreciation of the opening asset baseDepreciation of new capexCorporate fixed assetsClosing net book valueOpening net book valueCapital expenditureDepreciation
- How it is funded3 formulasDebtRepaymentsScheduled repaymentsPrepayments from an equity raise and the cash sweepDebtClosing balanceOpening balanceDrawdownsRepaymentsDebtInterest expenseOpening balanceAll-in interest rateshare of the year
- How profit becomes cash3 formulasWorking capitalTrade receivablesRevenuefrom statementsDebtor daysDays in periodWorking capitalInventoryDirect costs (positive)from statementsInventory daysDays in periodWorking capitalTrade payablesCash operating costs (positive)from statementsCreditor daysDays in period
28 parts, each one tested.
Every part is a tested building block with its own checks: yours is put together from the ones your business needs.
- CPI forecastConsensus curve with long-run anchor
- Corporate costsFixed cost base indexed to CPI
- Working capitalFull working capital
- Income taxCorporate rate with tax losses
- Corporate fixed assetsStraight-line over remaining life
- DebtAmortising term loan
- Discounted cash flow valuationDCF on free cash flow to the firm
- Multiples valuationEV / EBITDA multiple
- Net asset valueBook net asset value
- LeasesLease register
- Purchase price and acquisition costsAgreed price plus costs
- Hold-period cash flowsAsset-level NOI less capex
- Exit value and exit costsTerminal capitalisation rate
- Investment returnsIRR, equity multiple and cash-on-cash
- Key-metric summaryLast-twelve-month and run-rate metrics
- Covenant tests and headroomLVR, gearing and ICR for property
- Feasibility metricsCash-flow returns
- Discount rate (WACC)CAPM at target gearing
- New venues, acquisitions and refurbishments (top-down)Openings schedule with ramp to maturityNetwork growth when new venues are not modelled one by one — openings, acquisitions and refurbishment programmes with their capex, pre-opening costs and ramping earnings.
- Customer deposits, deferred revenue and loyaltyDeferred revenue as days of revenueMoney customers pay before they are served — travel and event deposits, advance tickets, gift cards, prepaid memberships — plus loyalty points, patron deposits and gaming jackpots owed to customers.
- Completed valueCapitalised income
- Venue registerOpening date, closing date and capacityWhen each venue trades and its capacity — the facts the venue revenue and cost parts build on.
- Food, beverage and secondary spend revenueCovers × average spend per headBar, food, function, concessions and merchandise sales at the venue.
- Cost of goods sold and content costsMargin by revenue streamCost of food, beverage and merchandise sold, and content costs such as film hire paid on box office.
- Venue labour costsWages as % of revenueWages, salaries and on-costs of venue staff.
- Venue rent and occupancy costsBase rent plus turnover rentRent and outgoings for leased venues, or holding costs for freehold venues (management view before lease accounting).
- Other venue operating costsCost lines with growthUtilities, repairs, marketing, security, cleaning, entertainment, licences and other site costs.
- Venue revenue and site EBITDA
The numbers it tracks.
- 01berths
- 02berth occupancy
- 03rate per metre
- 04boatyard revenue
- 05marina EBITDA
- 06value per berth
What it is used for.
- Operating forecastGuide · Financial projections
- ValuationGuide · DCF valuation model
- Lending and credit analysisGuide · Three-statement model
- Development feasibilityGuide · Financial modelling services
- Asset acquisition
More in fitness, leisure and attractions.
- Gym and fitness club financial model
- Cinema operator financial model
- Theme park and attraction financial model
- Family entertainment centre financial model
- Day spa and wellness retreat financial model
- Ski resort financial model
- Golf course financial model
- Airport lounge financial model
Looking for a marina financial model template? Ours arrives built for your business, with your figures in it.
Running a small business? Read what goes into a small business financial model.
See a finished model, sheet by sheetThe sample is built on illustrative figures and describes no real business. Models are calculations prepared from the information you provide. They are not financial advice and must be independently verified. See our terms.