Engineered wood products manufacturer financial model, built free.
A three-statement Excel model for a sawmill and engineered wood products manufacturer, built from your own figures and checked to balance.
- Free account
- No card
- Usually ready within the hour
We use generative AI in parts of our process, so mistakes can occur. Every model should be checked by a person before it is relied on. Read more
Saws logs into framing and appearance timber and makes panels (particleboard, MDF, plywood) and engineered wood (LVL, CLT, glulam) from log and residue supply contracts; prices follow housing activity and imports.
In short
- 01
Three linked statements
Income statement, balance sheet and cash flow, linked in every period.
- 02
Valued two ways
Discounted cash flow and trading multiples, side by side.
- 03
Monthly to annual
Monthly, quarterly, half-yearly or annual periods, for up to 30 years.
- 04
Checked every period
A Checks sheet shows the balance sheet balances and the cash reconciles.
The sample, as Excel draws it.
Built by the same system and checks as yours, on illustrative figures: every sheet as Excel draws it, or live.
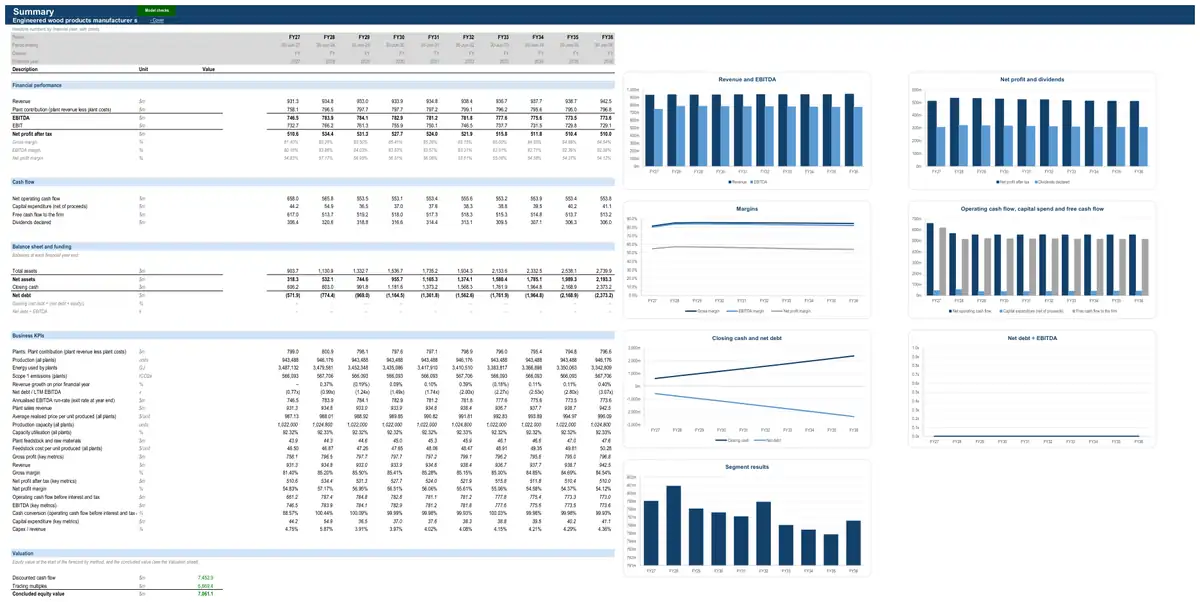
Illustrative figures: the sample describes no real business. The live preview shows values; your model’s Excel file has every formula.
How the model works for an engineered wood products manufacturer.
- How it earns revenue3 formulasProduct pricing and plant revenue · All plantsImport parity priceLanded price in model currencyImport dutyPort and delivery costsProduct pricing and plant revenue · All plantsPlant sales revenueProductionfrom capacity and productionRealised price per unitProduct pricing and plant revenue · All plantsRealised price per unitImport parity priceDiscount to import parityProduct mix and service premium
- What drives its costs3 formulasDirect labour · All plantsDirect labourFixed labourVariable labour (production × cost per unit)Maintenance · All plantsMaintenance costFixed maintenanceVariable maintenance (production × cost per unit)Plant fixed overheads · All plantsPlant fixed overheadsBase overheadsStep costs (extra shifts and lines)
- What it invests in3 formulasPlant capex and depreciation · All plantsPlant capital expenditureSustaining capexGrowth capexPlant capex and depreciation · All plantsPlant depreciationDepreciation of existing assetsDepreciation of sustaining additionsProject 1 depreciation (from commissioning)from from commissioningProject 2 depreciation (from commissioning)from from commissioningProject 3 depreciation (from commissioning)from from commissioningPlant capex and depreciation · All plantsClosing net book valueOpening net book valuePlant capital expenditurePlant depreciation
- How it is funded3 formulasDebtRepaymentsScheduled repaymentsPrepayments from an equity raise and the cash sweepDebtClosing balanceOpening balanceDrawdownsRepaymentsDebtInterest expenseOpening balanceAll-in interest rateshare of the year
- How profit becomes cash3 formulasWorking capitalTrade receivablesRevenuefrom statementsDebtor daysDays in periodWorking capitalInventoryDirect costs (positive)from statementsInventory daysDays in periodWorking capitalTrade payablesCash operating costs (positive)from statementsCreditor daysDays in period
24 parts, each one tested.
Every part is a tested building block with its own checks: yours is put together from the ones your business needs.
- CPI forecastConsensus curve with long-run anchor
- Exchange rate (US dollar)Exchange rate by financial year
- Operating expensesHeadcount build by function
- Corporate costsFixed cost base indexed to CPI
- Working capitalFull working capital
- Income taxCorporate rate with tax losses
- Corporate fixed assetsStraight-line over remaining life
- DebtAmortising term loan
- Dividends and distributionsPayout of net profit
- Discounted cash flow valuationDCF on free cash flow to the firm
- Multiples valuationEV / EBITDA multiple
- LeasesLease register
- InventoryWeighted average costRaw materials, work-in-progress and finished goods held to support production and sales (used in place of the inventory part of working capital), and the cost-of-sales effect of the costing method and stock provisions.
- Key-metric summaryLast-twelve-month and run-rate metrics
- Discount rate (WACC)CAPM at target gearing
- Terminal valuePerpetuity growth on normalised cash flow
- Capacity and productionOperating days × daily rateHow much a plant can make and how much it does make, from capacity, operating time, utilisation and yield.
- Direct labourFixed plus variable labourWages and on-costs of the production workforce at each plant.
- MaintenanceFixed plus cost per unitRoutine maintenance and periodic shutdowns needed to keep plant running.
- Plant fixed overheadsStep-fixed with shifts and linesSite costs that do not vary with output: site management and supervision, quality, site services, insurance, rates and other production overheads of each plant.
- Plant capex and depreciationSustaining capex plus growth projectsSustaining and expansion capital expenditure on plant, and the depreciation and book value that follow.
- Energy and carbonEnergy intensity × priceElectricity, gas and fuel used by a plant, and the cost of the carbon it emits.
- Feedstock and raw materialsConsumption rate × input priceRaw materials consumed by a process plant, from consumption rates and input prices.
- Product pricing and plant revenueBenchmark or import-parity priceRealised price of what a process plant sells and the revenue it earns.
The numbers it tracks.
- 01log intake (m³)
- 02sawn output and recovery
- 03price per m³
- 04log cost per m³
- 05EBITDA margin
What it is used for.
- Operating forecastGuide · Financial projections
- Budget and rolling forecastGuide · Cash flow forecast
- ValuationGuide · DCF valuation model
- Lending and credit analysisGuide · Three-statement model
- Merger or acquisition (strategic)Guide · Financial modelling services
- Scenarios and sensitivities
More in materials, chemicals and packaging.
- Building products manufacturer financial model
- Cement and concrete producer financial model
- Quarry financial model
- Steel producer financial model
- Coated steel products group financial model
- Chemicals and polymers producer financial model
- Specialty chemicals company financial model
- Industrial gases company financial model
- Ammonia and fertiliser producer financial model
- Packaging manufacturer financial model
- Cardboard and paper packaging producer financial model
Looking for an engineered wood products manufacturer financial model template? Ours arrives built for your business, with your figures in it.
See a finished model, sheet by sheetThe sample is built on illustrative figures and describes no real business. Models are calculations prepared from the information you provide. They are not financial advice and must be independently verified. See our terms.