Public hospital financial model, built free.
A three-statement Excel model for a public hospital or health service, built from your own figures and checked to balance.
- Free account
- No card
- Usually ready within the hour
We use generative AI in parts of our process, so mistakes can occur. Every model should be checked by a person before it is relied on. Read more
A local health district, hospital network or public health service funded by the state under a service agreement — activity-based funding per NWAU plus block funding — with own-source revenue from private and compensable patients, managed to a budget result rather than a profit.
In short
- 01
Three linked statements
Income statement, balance sheet and cash flow, linked in every period.
- 02
Valued two ways
Discounted cash flow and trading multiples, side by side.
- 03
Monthly to annual
Monthly, quarterly, half-yearly or annual periods, for up to 30 years.
- 04
Checked every period
A Checks sheet shows the balance sheet balances and the cash reconciles.
The sample, as Excel draws it.
Built by the same system and checks as yours, on illustrative figures: every sheet as Excel draws it, or live.
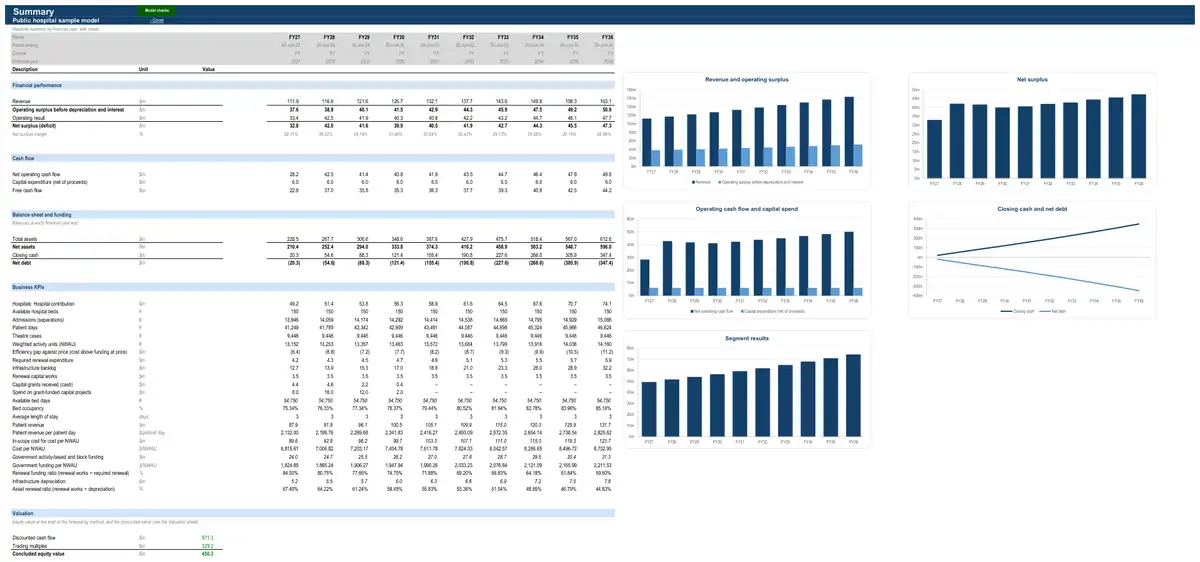
Illustrative figures: the sample describes no real business. The live preview shows values; your model’s Excel file has every formula.
How the model works for a public hospital.
- How it earns revenue3 formulasPatient revenue by payer · All hospitalsPatient revenuePrivate health insurer revenueDVA and state contract revenueCompensable revenueSelf-funded revenueActivity-based and block funding · All hospitalsWeighted activity units (NWAU)Admitted NWAUOther NWAUInfrastructure assets, capital works and depreciation · All infrastructure asset classesCapital worksRenewal worksUpgrade worksNew works
- What drives its costs3 formulasStaffing and wages · All hospitalsHospital staff costsWard nursing costsTheatre, allied health and support staff costsMedical consumables and prostheses · All hospitalsMedical consumables and prosthesesWard consumables and drugsSurgical consumables and prosthesesOperating expenses · Across the businessTotal FTEsOperations and deliverySales and marketingTechnologyFinance, HR and administration
- What it invests in3 formulasLeasesPrincipal elements of lease paymentsLease payments (cash)from cashInterest on lease liabilitiesLeasesClosing lease liabilitiesLease 1Lease 2Lease 3Lease 4Lease 5Lease 6LeasesLease payments (cash)Lease 1Lease 2Lease 3Lease 4Lease 5Lease 6
- How profit becomes cash3 formulasWorking capitalTrade receivablesRevenuefrom statementsDebtor daysDays in periodWorking capitalInventoryDirect costs (positive)from statementsInventory daysDays in periodWorking capitalTrade payablesCash operating costs (positive)from statementsCreditor daysDays in period
16 parts, each one tested.
Every part is a tested building block with its own checks: yours is put together from the ones your business needs.
- CPI forecastConsensus curve with long-run anchor
- Operating expensesHeadcount build by function
- Corporate costsFixed cost base indexed to CPI
- Working capitalFull working capital
- Discounted cash flow valuationDCF on free cash flow to the firm
- Multiples valuationEV / EBITDA multiple
- Capital grants and contributionsFunding mix by capital projectGrants to build or acquire assets the entity will control, recognised as income as the asset is built (AASB 1058 paragraphs 15–16; a conditional-grant liability under IPSAS 23 and similar standards), with unspent amounts held as a liability and the income kept below the operating result. Used by councils, agencies, health services, charities, clubs and housing providers.
- LeasesLease register
- Capacity and activityTheatre sessions × utilisation
- Patient revenue by payerPayer mix × rate
- Staffing and wagesNursing hours per patient day
- Medical consumables and prosthesesCost per patient day and per theatre case
- Activity-based and block fundingBlock fundingGovernment funding of a public hospital under its service agreement — activity-based funding (NWAU × price), block funding for small and specialised services, and state-only and specific-purpose funding.
- Cost per NWAU and efficiency gapIn-scope cost ÷ NWAUThe hospital's cost per weighted activity unit against the price it is paid — the gap that becomes a budget deficit unless closed by efficiencies or extra funding.
- Asset renewal requirement and backlogAnnual consumption as the requirementThe renewal spend each asset class needs to hold its target service level (from the asset management plan) and the backlog of assets below a satisfactory standard — the basis of the renewal gap.
- Infrastructure assets, capital works and depreciationCapital works program with straight-line depreciationRoll-forward of each asset class — capital works split into renewal, upgrade and new, assets contributed by developers, depreciation and revaluations — carried at fair value (current replacement cost) under AASB 116 and AASB 13 or IPSAS 17. Revaluation increments go to the asset revaluation reserve (other comprehensive income).
The numbers it tracks.
- 01NWAU delivered against purchased
- 02cost per NWAU against price
- 03budget result
- 04own-source revenue
- 05staff cost share
- 06cash days on hand
What it is used for.
- Budget and rolling forecastGuide · Cash flow forecast
- Operating forecastGuide · Financial projections
- Scenarios and sensitivities
More in government.
- Local council financial model
- Government business enterprise financial model
- Public agency financial model
Looking for a public hospital financial model template? Ours arrives built for your business, with your figures in it.
See a finished model, sheet by sheetThe sample is built on illustrative figures and describes no real business. Models are calculations prepared from the information you provide. They are not financial advice and must be independently verified. See our terms.