Rail freight operator financial model, built free.
A three-statement Excel model for a rail freight operator (above rail), built from your own figures and checked to balance.
- Free account
- No card
- Usually ready within the hour
We use generative AI in parts of our process, so mistakes can occur. Every model should be checked by a person before it is relied on. Read more
Hauls bulk, intermodal and general freight with its own locomotives and wagons, earning per-tonne haulage rates or take-or-pay contracts and paying access to the track owner.
In short
- 01
Three linked statements
Income statement, balance sheet and cash flow, linked in every period.
- 02
Valued two ways
Discounted cash flow and trading multiples, side by side.
- 03
Monthly to annual
Monthly, quarterly, half-yearly or annual periods, for up to 30 years.
- 04
Checked every period
A Checks sheet shows the balance sheet balances and the cash reconciles.
The sample, as Excel draws it.
Built by the same system and checks as yours, on illustrative figures: every sheet as Excel draws it, or live.
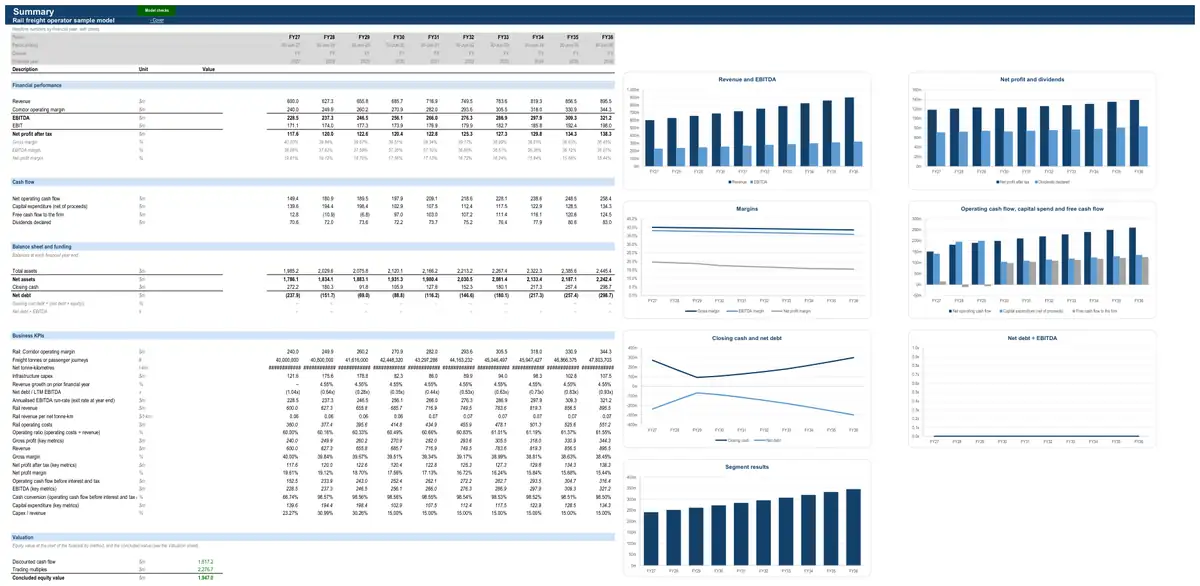
Illustrative figures: the sample describes no real business. The live preview shows values; your model’s Excel file has every formula.
How the model works for a rail freight operator.
- How it earns revenue1 partsHaulage, access and fare revenue
- What drives its costs3 formulasRail operating costs · All rail corridorsRail operating costsVariable operating costs (NTK × unit cost)Fixed corridor costsOperating expenses · Across the businessTotal FTEsOperations and deliverySales and marketingTechnologyFinance, HR and administrationOperating expenses · Across the businessTotal average FTEsOperations and deliverySales and marketingTechnologyFinance, HR and administration
- What it invests in3 formulasInfrastructure assets and capex programme · Across the businessInfrastructure capexSustaining capexGrowth capexInfrastructure assets and capex programme · Across the businessInfrastructure depreciationDepreciation of existing assetsDepreciation of sustaining additionsProject 1 depreciation (from commissioning)Project 2 depreciation (from commissioning)Project 3 depreciation (from commissioning)from from commissioningInfrastructure assets and capex programme · Across the businessClosing net book valueOpening net book valueInfrastructure capexInfrastructure depreciation
- How it is funded3 formulasDebtRepaymentsScheduled repaymentsPrepayments from an equity raise and the cash sweepDebtClosing balanceOpening balanceDrawdownsRepaymentsDebtInterest expenseOpening balanceAll-in interest rateshare of the year
- How profit becomes cash3 formulasWorking capitalTrade receivablesRevenuefrom statementsDebtor daysDays in periodWorking capitalInventoryDirect costs (positive)from statementsInventory daysDays in periodWorking capitalTrade payablesCash operating costs (positive)from statementsCreditor daysDays in period
19 parts, each one tested.
Every part is a tested building block with its own checks: yours is put together from the ones your business needs.
- CPI forecastConsensus curve with long-run anchor
- Operating expensesHeadcount build by function
- Corporate costsFixed cost base indexed to CPI
- Working capitalFull working capital
- Income taxCorporate rate with tax losses
- Corporate fixed assetsStraight-line over remaining life
- DebtAmortising term loan
- Dividends and distributionsPayout of net profit
- Discounted cash flow valuationDCF on free cash flow to the firm
- Multiples valuationEV / EBITDA multiple
- Interest-rate hedgingHedged share at a fixed rate
- Infrastructure assets and capex programmeSustaining capex plus growth projectsOwned or long-lease infrastructure — runways, terminals, berths, track, rolling stock, stadiums — with its capex programme, depreciation by asset class and optional revaluation.
- LeasesLease register
- Key-metric summaryLast-twelve-month and run-rate metrics
- Discount rate (WACC)CAPM at target gearing
- Terminal valuePerpetuity growth on normalised cash flow
- Rail volumes and patronageBase volume × growthFreight tonnes (and tonne-km) or passenger journeys on each corridor.
- Haulage, access and fare revenueVolume × rateRevenue from hauling freight, charging for track access or carrying passengers.
- Rail operating costsCost per net tonne-km or journeyTrain crew, fuel, rolling-stock maintenance and access charges for train operators, and track maintenance and train control for network owners.
The numbers it tracks.
- 01tonnes and net tonne-km
- 02revenue per NTK
- 03operating ratio
- 04EBITDA margin
- 05fleet utilisation
What it is used for.
- Operating forecastGuide · Financial projections
- Budget and rolling forecastGuide · Cash flow forecast
- ValuationGuide · DCF valuation model
- Lending and credit analysisGuide · Three-statement model
- Merger or acquisition (strategic)Guide · Financial modelling services
- Scenarios and sensitivities
More in airlines, shipping, rail and buses.
- Airline financial model
- Cargo airline financial model
- Shipping company financial model
- Container shipping line financial model
- Rail network owner financial model
- Passenger rail operator financial model
- Bus company financial model
- Ferry operator financial model
Looking for a rail freight operator financial model template? Ours arrives built for your business, with your figures in it.
See a finished model, sheet by sheetThe sample is built on illustrative figures and describes no real business. Models are calculations prepared from the information you provide. They are not financial advice and must be independently verified. See our terms.