Annuity provider financial model, built free.
A three-statement Excel model for an annuity and retirement income provider, built from your own figures and checked to balance.
- Free account
- No card
- Usually ready within the hour
We use generative AI in parts of our process, so mistakes can occur. Every model should be checked by a person before it is relied on. Read more
Life company selling fixed-term and lifetime annuities, investing the proceeds in fixed income, property and alternatives, and earning the spread between asset returns and the rates credited to annuitants.
In short
- 01
Three linked statements
Income statement, balance sheet and cash flow, linked in every period.
- 02
Valued three ways
Trading multiples, net asset value and financial institution equity valuation, side by side.
- 03
Monthly to annual
Monthly, quarterly, half-yearly or annual periods, for up to 30 years.
- 04
Checked every period
A Checks sheet shows the balance sheet balances and the cash reconciles.
The sample, as Excel draws it.
Built by the same system and checks as yours, on illustrative figures: every sheet as Excel draws it, or live.
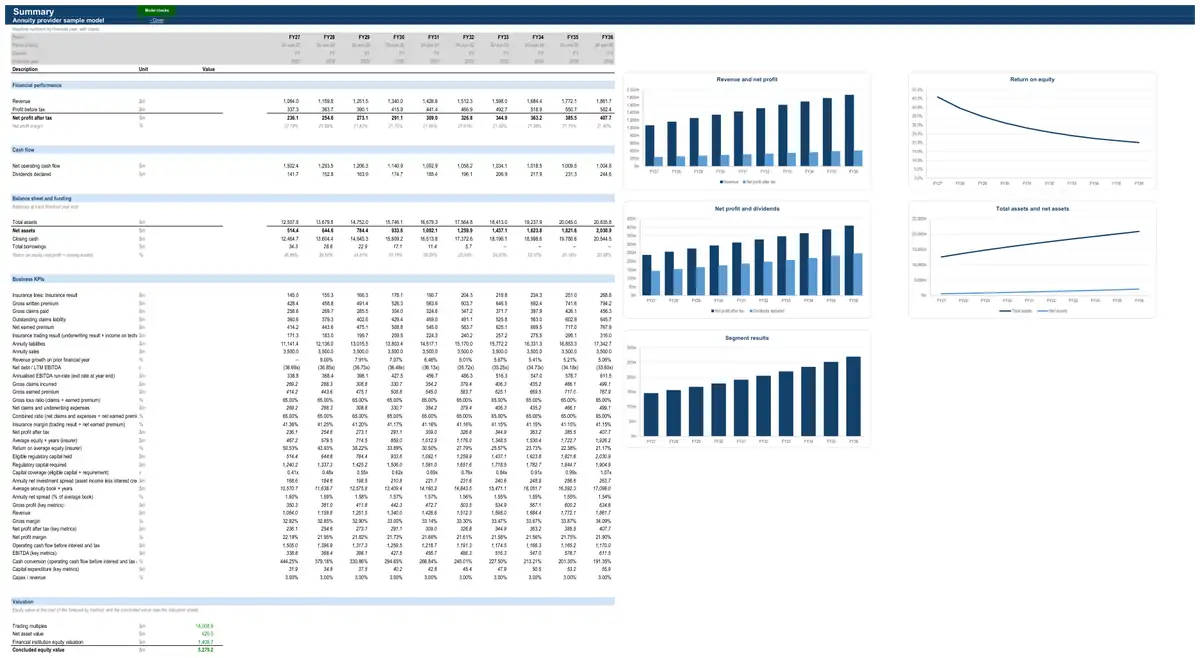
Illustrative figures: the sample describes no real business. The live preview shows values; your model’s Excel file has every formula.
How the model works for an annuity provider.
- How it earns revenue3 formulasPremiums · Insurance line 1Gross earned premiumEarned from the opening unearned premiumEarned from premium written since the start datePremiums · Insurance line 1Closing unearned premiumOpening unearned premiumGross written premiumGross earned premiumInvestment income · Across the businessAverage technical funds (net of reinsurance)Opening unearned premium liabilityUnearned premium liabilityfrom all unitsOpening outstanding claims liabilityOutstanding claims liabilityfrom all unitsLess opening reinsurance recoveries receivableLess closing reinsurance recoveries receivable
- What drives its costs3 formulasClaims and loss ratios · Insurance line 1Gross claims incurredGross earned premiumfrom premiumsGross loss ratioOperating expenses · Across the businessTotal FTEsOperations and deliverySales and marketingTechnologyFinance, HR and administrationOperating expenses · Across the businessTotal average FTEsOperations and deliverySales and marketingTechnologyFinance, HR and administration
- What it invests in3 formulasCorporate fixed assetsCapital expenditureRevenuefrom statementsCapex as % of revenueAdditional planned capexCorporate fixed assetsDepreciationDepreciation of the opening asset baseDepreciation of new capexCorporate fixed assetsClosing net book valueOpening net book valueCapital expenditureDepreciation
- How it is funded3 formulasDebtRepaymentsScheduled repaymentsPrepayments from an equity raise and the cash sweepDebtClosing balanceOpening balanceDrawdownsRepaymentsDebtInterest expenseOpening balanceAll-in interest rateshare of the year
- How profit becomes cash3 formulasClaims reserves · Insurance line 1Claims paid on claims incurred since the start datePaid in the first year after being incurredPaid in the second yearPaid in the third yearPaid in the fourth yearPaid in the fifth yearPaid in the sixth yearPaid in years seven to tenClaims reserves · Insurance line 1Closing outstanding claimsOpening outstanding claimsGross claims incurredfrom claims and loss ratiosClaims paidClaims reserves · Insurance line 1Claims paidClaims paid on claims incurred since the start dateClaims paid from the opening liability
21 parts, each one tested.
Every part is a tested building block with its own checks: yours is put together from the ones your business needs.
- CPI forecastConsensus curve with long-run anchor
- Operating expensesHeadcount build by function
- Corporate costsFixed cost base indexed to CPI
- Income taxCorporate rate with tax losses
- Corporate fixed assetsStraight-line over remaining life
- DebtAmortising term loan
- Equity raisingDistribution reinvestment plan
- Dividends and distributionsPayout of net profit
- Multiples valuationEV / EBITDA multiple
- Net asset valueBook net asset value
- Investment incomeAsset allocation × expected returnsReturns on the investment portfolio backing technical reserves and shareholders' funds.
- Solvency capitalRisk charges buildRegulatory capital required (prescribed capital amount or solvency capital requirement) and the coverage held, driving dividends and raisings.
- Annuity book and investment spreadSales, maturities and interest creditedAnnuity liabilities rolled forward from sales, payments and maturities, and the interest credited to annuitants that is set against the investment return on backing assets.
- Embedded value and value of new businessAppraisal value (EV plus new business multiple)The value of a life insurer's in-force book and of each year's new business, used to value life companies and measure their growth.
- Financial-institution equity valuationJustified price to bookEquity value of banks, insurers and other balance-sheet businesses, where debt is raw material rather than financing, so value comes from returns on equity, capital and distributable earnings.
- Key-metric summaryLast-twelve-month and run-rate metrics
- Case selectionStackable stress toggles
- Interest-rate forecastMarket forward curve
- PremiumsGWP growthGross written premium and how it is earned over the cover period, leaving an unearned premium liability.
- Claims and loss ratiosLoss ratio on earned premiumClaims incurred on earned premium — attritional, large and catastrophe claims, or mortality and morbidity for life risk.
- Claims reservesPayment patternOutstanding claims liability built from claims incurred, the payment pattern, discounting and the risk adjustment.
The numbers it tracks.
- 01annuity sales
- 02book growth
- 03maturities
- 04net spread (COE margin)
- 05normalised profit
- 06capital ratio
- 07return on equity
What it is used for.
- Operating forecastGuide · Financial projections
- ValuationGuide · DCF valuation model
- Equity capital raisingGuide · Startup financial model
- Scenarios and sensitivities
More in insurance.
- General insurer financial model
- Life insurer financial model
- Health insurer financial model
- Reinsurer financial model
- Underwriting agency (MGA) financial model
- Insurance broker financial model
Looking for an annuity provider financial model template? Ours arrives built for your business, with your figures in it.
See a finished model, sheet by sheetThe sample is built on illustrative figures and describes no real business. Models are calculations prepared from the information you provide. They are not financial advice and must be independently verified. See our terms.