Cloud hosting provider financial model, built free.
A three-statement Excel model for a cloud, GPU compute and hosting provider, built from your own figures and checked to balance.
- Free account
- No card
- Usually ready within the hour
We use generative AI in parts of our process, so mistakes can occur. Every model should be checked by a person before it is relied on. Read more
Owns servers and GPU clusters in its own or colocated data centres and rents compute, storage and hosting by the hour or under multi-year reserved contracts, with capital-intensive hardware refreshed every few years.
In short
- 01
Three linked statements
Income statement, balance sheet and cash flow, linked in every period.
- 02
Valued two ways
Discounted cash flow and trading multiples, side by side.
- 03
Monthly to annual
Monthly, quarterly, half-yearly or annual periods, for up to 30 years.
- 04
Checked every period
A Checks sheet shows the balance sheet balances and the cash reconciles.
The sample, as Excel draws it.
Built by the same system and checks as yours: its structure and its inputs, ready for your own figures.
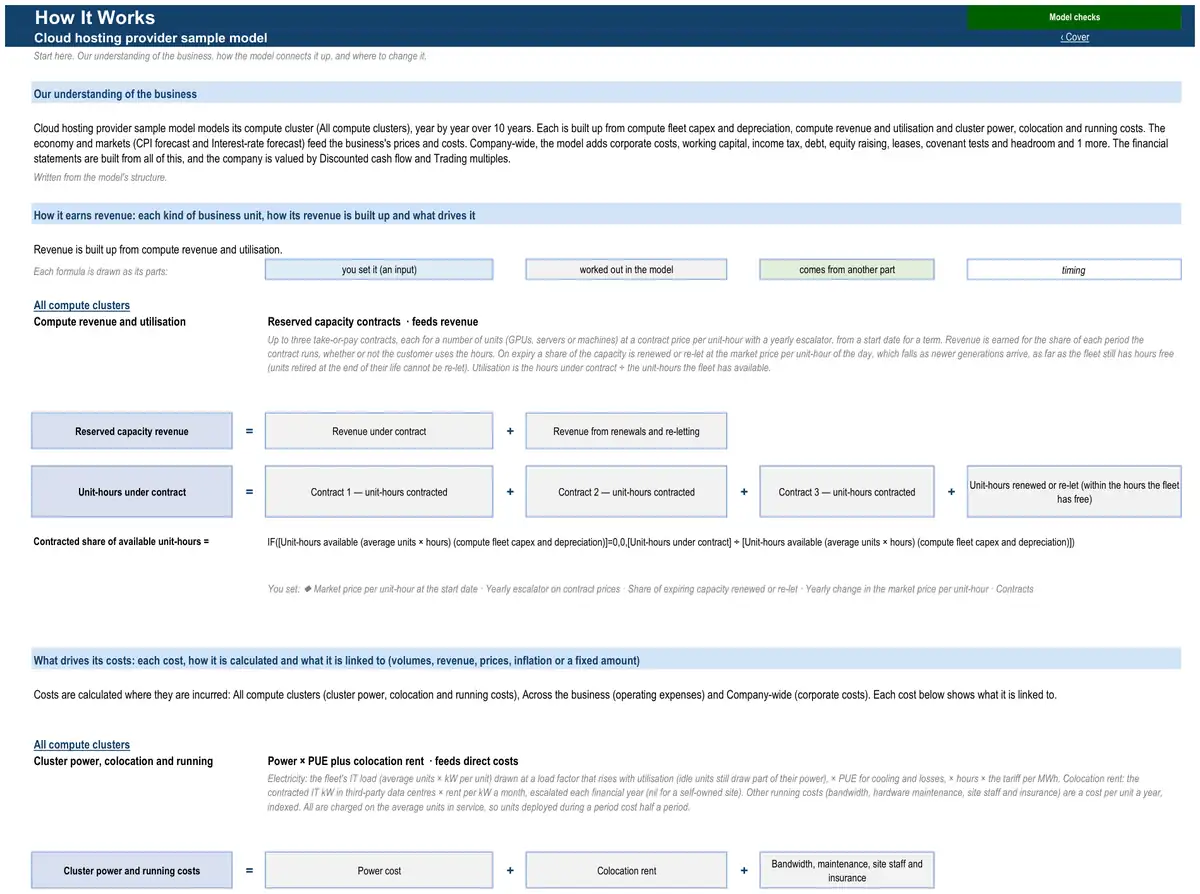
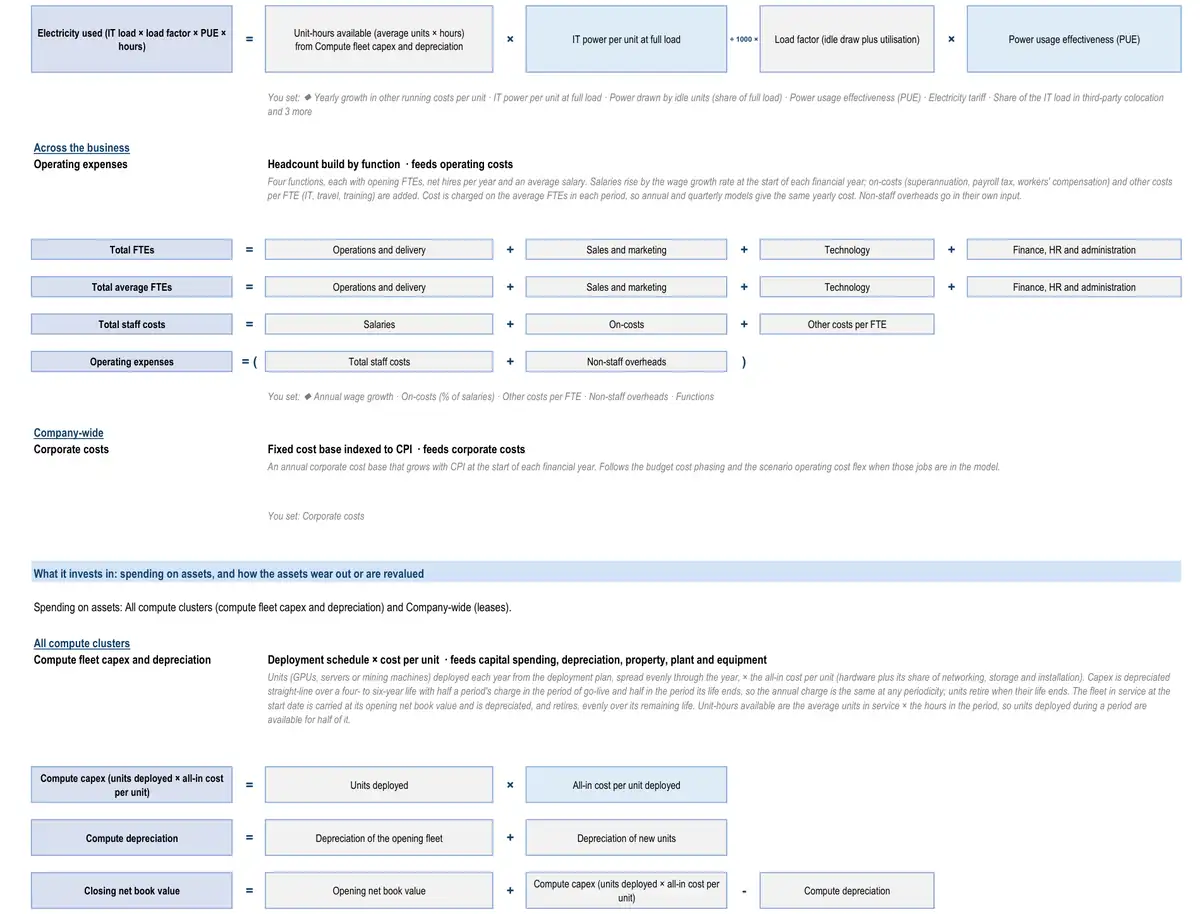
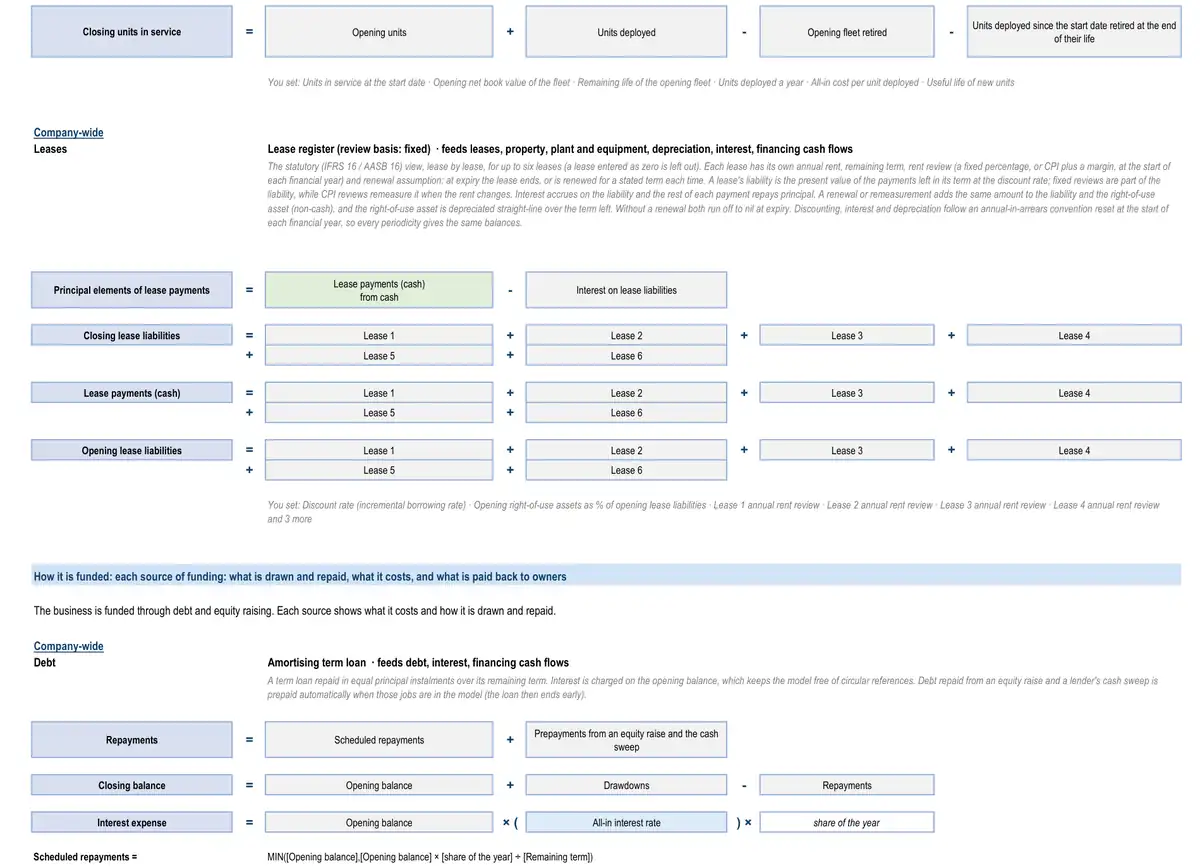
The sample describes no real business. Yours is calibrated to your own figures, so its results are your business’s.
How the model works for a cloud hosting provider.
- How it earns revenue2 formulasCompute revenue and utilisation · All compute clustersReserved capacity revenueRevenue under contractRevenue from renewals and re-lettingCompute revenue and utilisation · All compute clustersUnit-hours under contractContract 1 — unit-hours contractedContract 2 — unit-hours contractedContract 3 — unit-hours contractedUnit-hours renewed or re-let (within the hours the fleet has free)
- What drives its costs3 formulasCluster power, colocation and running costs · All compute clustersCluster power and running costsPower costColocation rentBandwidth, maintenance, site staff and insuranceCluster power, colocation and running costs · All compute clustersElectricity used (IT load × load factor × PUE × hours)Unit-hours available (average units × hours)from compute fleet capex and depreciationIT power per unit at full loadLoad factor (idle draw plus utilisation)Power usage effectiveness (PUE)Operating expenses · Across the businessTotal FTEsOperations and deliverySales and marketingTechnologyFinance, HR and administration
- What it invests in3 formulasCompute fleet capex and depreciation · All compute clustersCompute capex (units deployed × all-in cost per unit)Units deployedAll-in cost per unit deployedCompute fleet capex and depreciation · All compute clustersCompute depreciationDepreciation of the opening fleetDepreciation of new unitsCompute fleet capex and depreciation · All compute clustersClosing net book valueOpening net book valueCompute capex (units deployed × all-in cost per unit)Compute depreciation
- How it is funded3 formulasDebtRepaymentsScheduled repaymentsPrepayments from an equity raise and the cash sweepDebtClosing balanceOpening balanceDrawdownsRepaymentsDebtInterest expenseOpening balanceAll-in interest rateshare of the year
- How profit becomes cash3 formulasWorking capitalTrade receivablesRevenuefrom statementsDebtor daysDays in periodWorking capitalInventoryDirect costs (positive)from statementsInventory daysDays in periodWorking capitalTrade payablesCash operating costs (positive)from statementsCreditor daysDays in period
19 parts, each one tested.
Every part is a tested building block with its own checks: yours is put together from the ones your business needs.
- CPI forecastConsensus curve with long-run anchor
- Operating expensesHeadcount build by function
- Corporate costsFixed cost base indexed to CPI
- Working capitalFull working capital
- Income taxCorporate rate with tax losses
- DebtAmortising term loan
- Equity raisingDistribution reinvestment plan
- Discounted cash flow valuationDCF on free cash flow to the firm
- Multiples valuationEV / EBITDA multiple
- LeasesLease register
- Key-metric summaryLast-twelve-month and run-rate metrics
- Covenant tests and headroomLVR, gearing and ICR for property
- Debt capacityLoan-to-value capacity
- Case selectionStackable stress toggles
- Headcount plan by functionHiring plan by functionEmployees and staff cost by function (cost of revenue, sales and marketing, R&D, G&A).
- Interest-rate forecastMarket forward curve
- Compute fleet capex and depreciationDeployment schedule × cost per unitServers, GPUs, networking or mining machines deployed in a cluster, their capex, depreciation and book value.
- Compute revenue and utilisationReserved capacity contractsRevenue from renting compute or hosting, or from mining, earned on a cluster's capacity.
- Cluster power, colocation and running costsPower × PUE plus colocation rentPower, colocation rent, bandwidth and site costs of running a compute cluster.
The numbers it tracks.
- 01GPUs or servers deployed
- 02utilisation
- 03revenue per GPU-hour
- 04contracted backlog
- 05EBITDA margin
- 06capex
- 07payback per cluster
- 08debt service cover
What it is used for.
- Operating forecastGuide · Financial projections
- ValuationGuide · DCF valuation model
- Lending and credit analysisGuide · Three-statement model
- Project financeGuide · Financial modelling services
- Equity capital raisingGuide · Startup financial model
- Scenarios and sensitivities
More in IT services and infrastructure.
- IT services company financial model
- Managed service provider (MSP) financial model
- IT consulting firm financial model
- Data centre operator financial model
- Technology distributor financial model
- Bitcoin mining company financial model
Looking for a cloud hosting provider financial model template? Ours arrives built for your business, with your figures in it.
See a finished model, sheet by sheetThe sample is built on illustrative figures and describes no real business. Models are calculations prepared from the information you provide. They are not financial advice and must be independently verified. See our terms.