Game studio financial model, built free.
A three-statement Excel model for a game developer and publisher, built from your own figures and checked to balance.
- Free account
- No card
- Usually ready within the hour
We use generative AI in parts of our process, so mistakes can occur. Every model should be checked by a person before it is relied on. Read more
Develops premium and free-to-play games for console, PC and mobile, earning unit sales, in-game purchases, downloadable content and licensing, after platform fees.
In short
- 01
Three linked statements
Income statement, balance sheet and cash flow, linked in every period.
- 02
Valued three ways
Discounted cash flow, trading multiples and sum of the parts, side by side.
- 03
Monthly to annual
Monthly, quarterly, half-yearly or annual periods, for up to 30 years.
- 04
Checked every period
A Checks sheet shows the balance sheet balances and the cash reconciles.
The sample, as Excel draws it.
Built by the same system and checks as yours: its structure and its inputs, ready for your own figures.
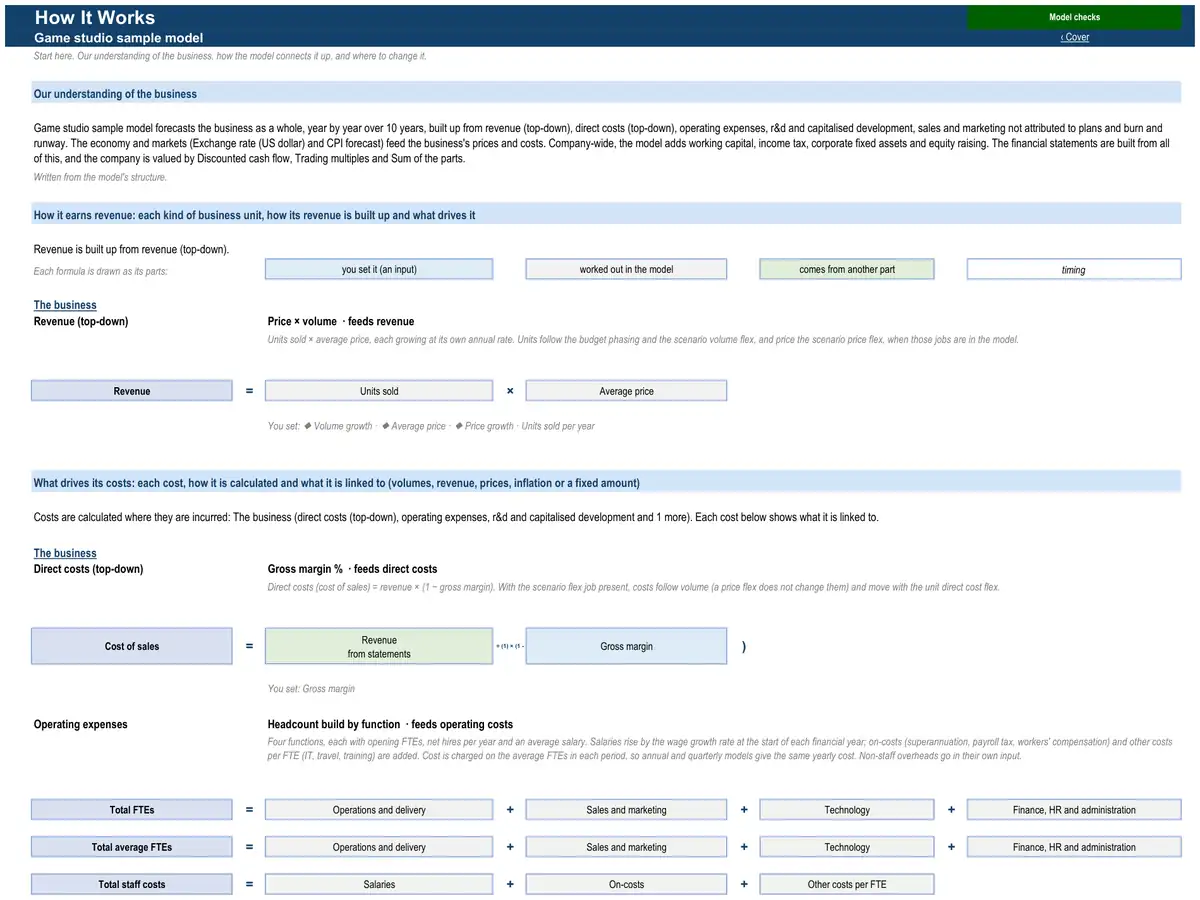
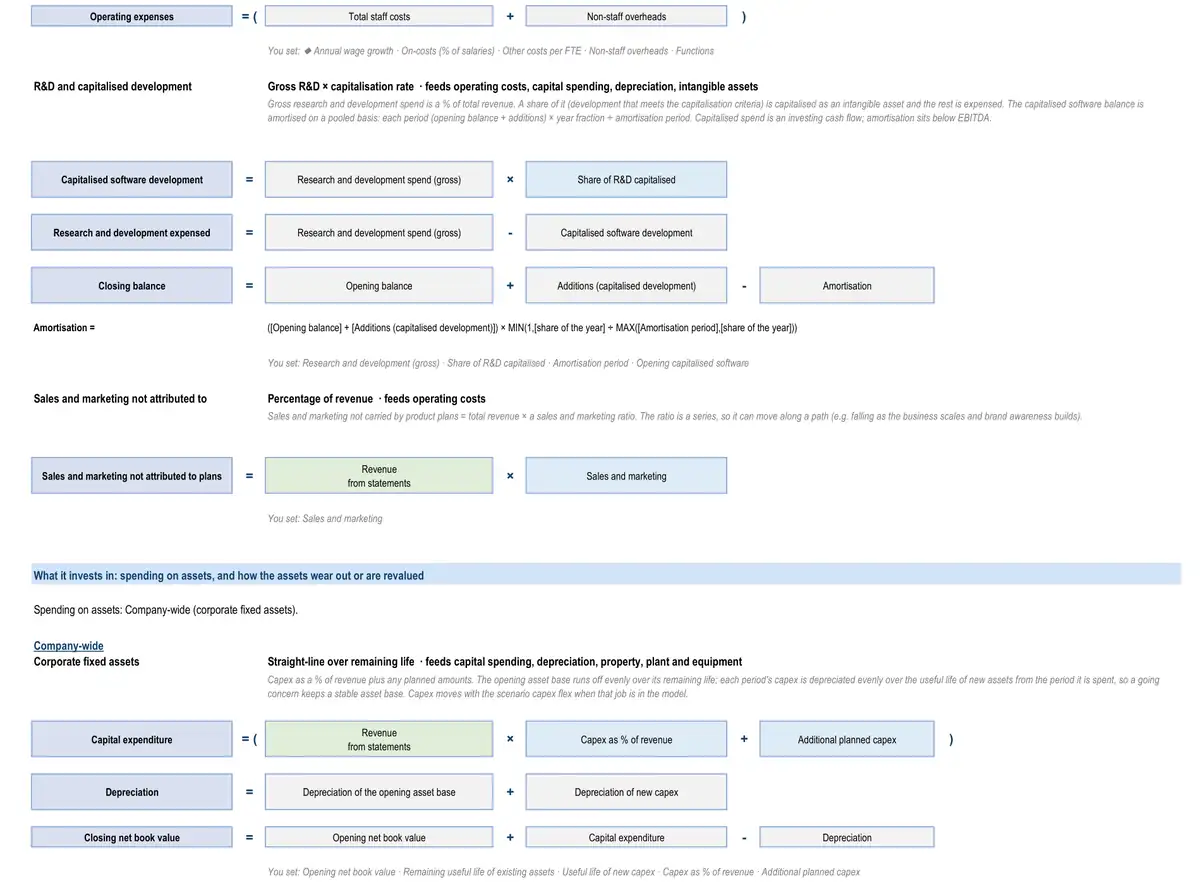
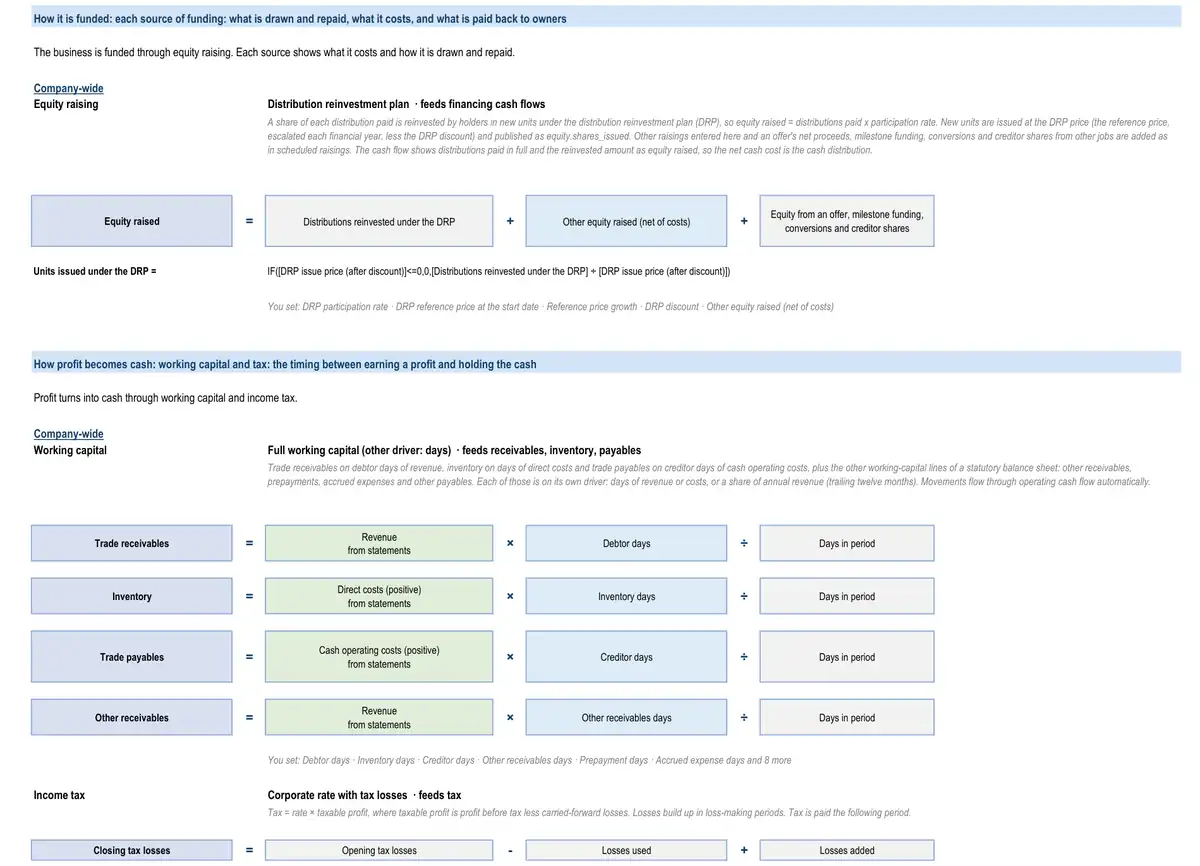
The sample describes no real business. Yours is calibrated to your own figures, so its results are your business’s.
How the model works for a game studio.
- How it earns revenue1 formulaRevenue (top-down) · The businessRevenueUnits soldAverage price
- What drives its costs3 formulasDirect costs (top-down) · The businessCost of salesRevenuefrom statementsGross marginOperating expenses · The businessTotal FTEsOperations and deliverySales and marketingTechnologyFinance, HR and administrationOperating expenses · The businessTotal average FTEsOperations and deliverySales and marketingTechnologyFinance, HR and administration
- What it invests in3 formulasCorporate fixed assetsCapital expenditureRevenuefrom statementsCapex as % of revenueAdditional planned capexCorporate fixed assetsDepreciationDepreciation of the opening asset baseDepreciation of new capexCorporate fixed assetsClosing net book valueOpening net book valueCapital expenditureDepreciation
- How it is funded1 formulaEquity raisingEquity raisedDistributions reinvested under the DRPOther equity raised (net of costs)Equity from an offer, milestone funding, conversions and creditor shares
- How profit becomes cash3 formulasWorking capitalTrade receivablesRevenuefrom statementsDebtor daysDays in periodWorking capitalInventoryDirect costs (positive)from statementsInventory daysDays in periodWorking capitalTrade payablesCash operating costs (positive)from statementsCreditor daysDays in period
19 parts, each one tested.
Every part is a tested building block with its own checks: yours is put together from the ones your business needs.
- Exchange rate (US dollar)Exchange rate by financial year
- Revenue (top-down)Price × volume
- Direct costs (top-down)Gross margin %
- Operating expensesHeadcount build by function
- Working capitalFull working capital
- Income taxCorporate rate with tax losses
- Corporate fixed assetsStraight-line over remaining life
- Equity raisingDistribution reinvestment plan
- Discounted cash flow valuationDCF on free cash flow to the firm
- Multiples valuationEV / EBITDA multiple
- Key-metric summaryLast-twelve-month and run-rate metrics
- Case selectionStackable stress toggles
- Sum of the partsRegister of parts on mixed bases
- Burn and runwayRunway to the forecast cash-out date
- R&D and capitalised developmentGross R&D × capitalisation rateResearch and development expense after capitalisation, with the capitalised software asset and its amortisation.
- Headcount plan by functionHiring plan by functionEmployees and staff cost by function (cost of revenue, sales and marketing, R&D, G&A).
- Sales and marketing not attributed to plansPercentage of revenueEntity-level sales and marketing for businesses without product plans (marketplaces, payments, ad platforms, game studios) and for central brand spend deliberately not allocated to plans.
- CPI forecastCPI glide path
- Enterprise value to equity bridgeNet debt at the valuation date
The numbers it tracks.
- 01net bookings
- 02units sold
- 03DAU
- 04ARPDAU
- 05payer conversion
- 06capitalised development
- 07EBITDA
What it is used for.
- Operating forecastGuide · Financial projections
- Budget and rolling forecastGuide · Cash flow forecast
- ValuationGuide · DCF valuation model
- Startup and venture fundingGuide · Startup financial model
- Equity capital raisingGuide · Startup financial model
- Merger or acquisition (strategic)Guide · Financial modelling services
- Scenarios and sensitivities
More in software and SaaS.
- B2B SaaS financial model
- Vertical SaaS financial model
- Usage-based software and API company financial model
- Subscription app financial model
- Enterprise software company financial model
- Product-led software company financial model
- Cybersecurity vendor financial model
- Data and analytics company financial model
- AI company financial model
Looking for a game studio financial model template? Ours arrives built for your business, with your figures in it.
See a finished model, sheet by sheetThe sample is built on illustrative figures and describes no real business. Models are calculations prepared from the information you provide. They are not financial advice and must be independently verified. See our terms.