Rolling stock leasing company financial model, built free.
A three-statement Excel model for a passenger rolling stock lessor, built from your own figures and checked to balance.
- Free account
- No card
- Usually ready within the hour
We use generative AI in parts of our process, so mistakes can occur. Every model should be checked by a person before it is relied on. Read more
Owns passenger trains and leases them to train operating companies or governments with capital rent and maintenance rent, often under long availability-style contracts.
In short
- 01
Three linked statements
Income statement, balance sheet and cash flow, linked in every period.
- 02
Valued and tested
Discounted cash flow, with scenarios on the key drivers.
- 03
Monthly to annual
Monthly, quarterly, half-yearly or annual periods, for up to 30 years.
- 04
Checked every period
A Checks sheet shows the balance sheet balances and the cash reconciles.
The sample, as Excel draws it.
Built by the same system and checks as yours: its structure and its inputs, ready for your own figures.
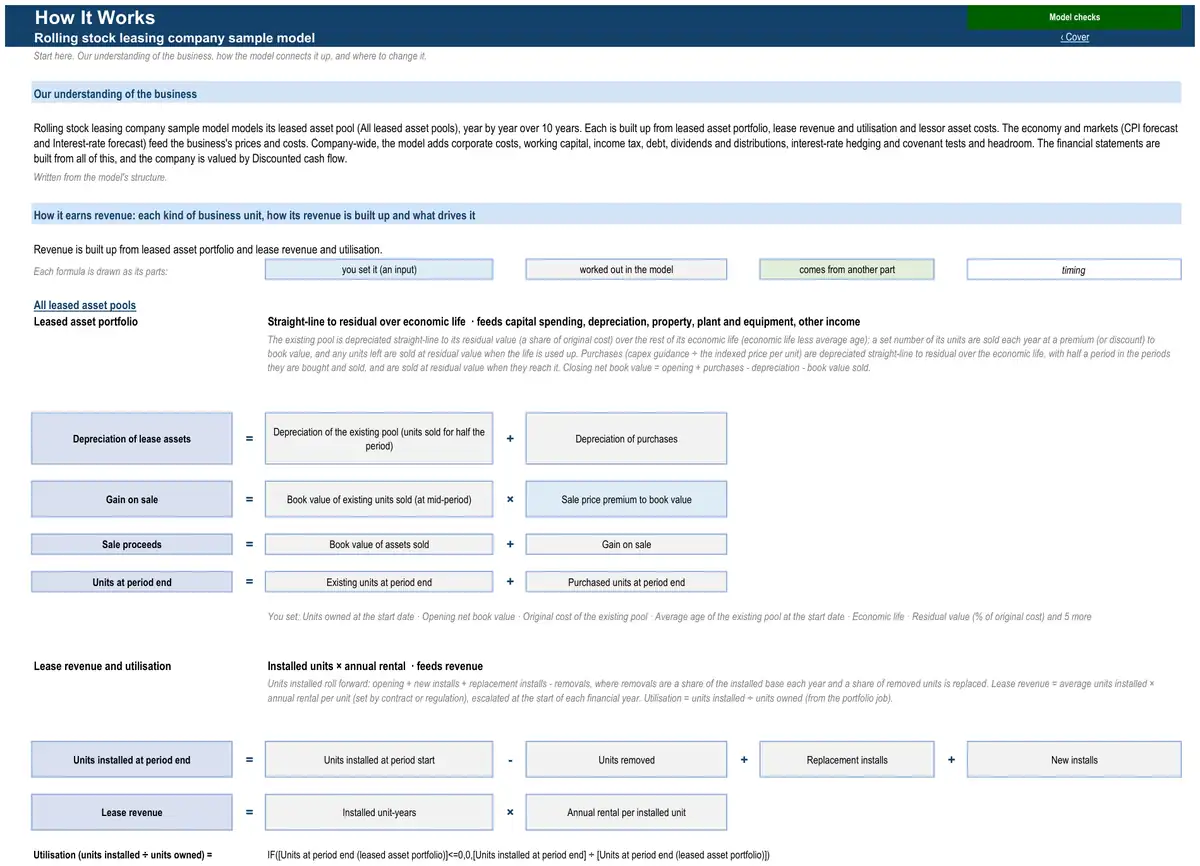
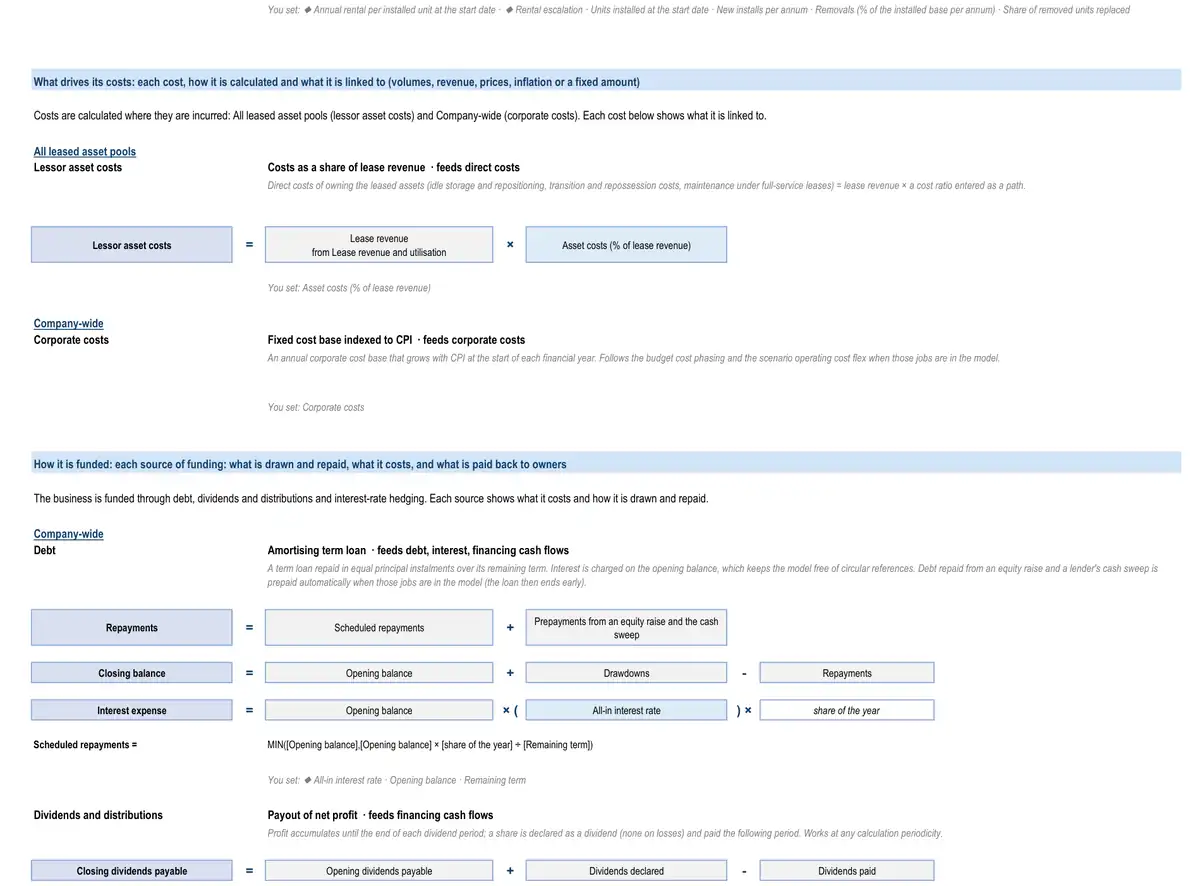
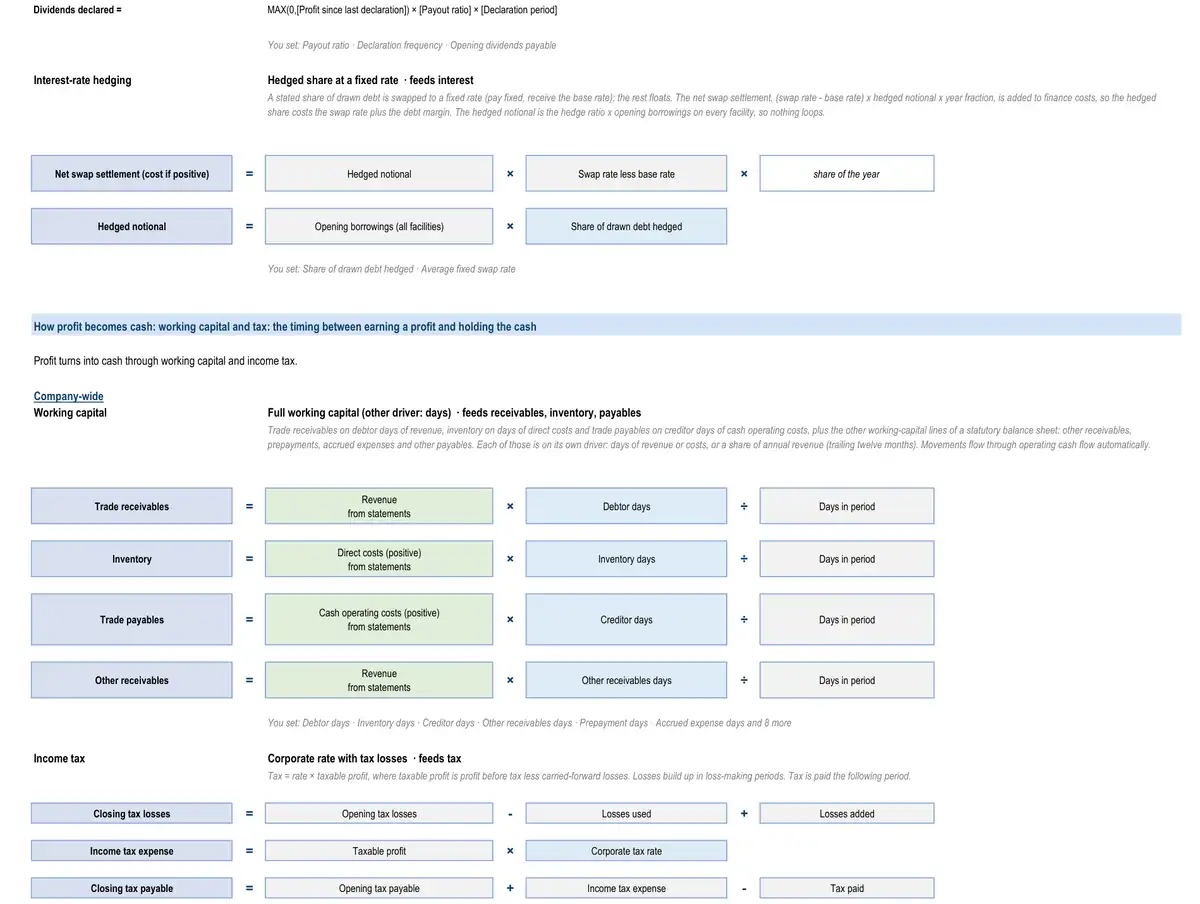
The sample describes no real business. Yours is calibrated to your own figures, so its results are your business’s.
How the model works for a rolling stock leasing company.
- How it earns revenue3 formulasLeased asset portfolio · All leased asset poolsDepreciation of lease assetsDepreciation of the existing pool (units sold for half the period)Depreciation of purchasesLeased asset portfolio · All leased asset poolsGain on saleBook value of existing units sold (at mid-period)Sale price premium to book valueLeased asset portfolio · All leased asset poolsSale proceedsBook value of assets soldGain on sale
- What drives its costs1 formulaLessor asset costs · All leased asset poolsLessor asset costsLease revenuefrom lease revenue and utilisationAsset costs (% of lease revenue)
- How it is funded3 formulasDebtRepaymentsScheduled repaymentsPrepayments from an equity raise and the cash sweepDebtClosing balanceOpening balanceDrawdownsRepaymentsDebtInterest expenseOpening balanceAll-in interest rateshare of the year
- How profit becomes cash3 formulasWorking capitalTrade receivablesRevenuefrom statementsDebtor daysDays in periodWorking capitalInventoryDirect costs (positive)from statementsInventory daysDays in periodWorking capitalTrade payablesCash operating costs (positive)from statementsCreditor daysDays in period
16 parts, each one tested.
Every part is a tested building block with its own checks: yours is put together from the ones your business needs.
- CPI forecastConsensus curve with long-run anchor
- Corporate costsFixed cost base indexed to CPI
- Working capitalFull working capital
- Income taxCorporate rate with tax losses
- DebtAmortising term loan
- Dividends and distributionsPayout of net profit
- Discounted cash flow valuationDCF on free cash flow to the firm
- Interest-rate hedgingHedged share at a fixed rate
- Key-metric summaryLast-twelve-month and run-rate metrics
- Covenant tests and headroomLVR, gearing and ICR for property
- Discount rate (WACC)CAPM at target gearing
- Terminal valuePerpetuity growth on normalised cash flow
- Interest-rate forecastMarket forward curve
- Leased asset portfolioStraight-line to residual over economic lifeAssets owned for lease — aircraft, engines, containers, railcars, rolling stock, meters — purchases, sales, depreciation to residual value and impairment.
- Lease revenue and utilisationInstalled units × annual rentalRent earned on each pool from lease rates, utilisation and re-leasing, including maintenance reserves and installed-base rentals.
- Lessor asset costsCosts as a share of lease revenueDirect costs of owning leased assets — idle storage and repositioning, transition and repossession costs, and maintenance under full-service leases.
The numbers it tracks.
- 01fleet
- 02contracted rent
- 03re-lease risk
- 04maintenance cost per vehicle
- 05net debt / RAV
What it is used for.
- Operating forecastGuide · Financial projections
- ValuationGuide · DCF valuation model
- Lending and credit analysisGuide · Three-statement model
- Project financeGuide · Financial modelling services
- Asset acquisition
More in leasing and infrastructure assets.
- Infrastructure fund financial model
- PPP social infrastructure project financial model
- Water treatment PPP financial model
- Stadium and arena financial model
- Telecom tower company financial model
- Smart metering company financial model
- Aircraft leasing company financial model
- Container leasing company financial model
Looking for a rolling stock leasing company financial model template? Ours arrives built for your business, with your figures in it.
See a finished model, sheet by sheetThe sample is built on illustrative figures and describes no real business. Models are calculations prepared from the information you provide. They are not financial advice and must be independently verified. See our terms.