Community housing provider financial model, built free.
A three-statement Excel model for a community housing provider, built from your own figures and checked to balance.
- Free account
- No card
- Usually ready within the hour
We use generative AI in parts of our process, so mistakes can occur. Every model should be checked by a person before it is relied on. Read more
A registered not-for-profit landlord housing low- and moderate-income tenants at rents set as a share of household income plus Commonwealth Rent Assistance, or at a discount to market, topped up by government subsidies, and growing through grants, Housing Australia finance and stock transfers.
In short
- 01
Three linked statements
Income statement, balance sheet and cash flow, linked in every period.
- 02
Valued two ways
Discounted cash flow and trading multiples, side by side.
- 03
Monthly to annual
Monthly, quarterly, half-yearly or annual periods, for up to 30 years.
- 04
Checked every period
A Checks sheet shows the balance sheet balances and the cash reconciles.
The sample, as Excel draws it.
Built by the same system and checks as yours, on illustrative figures: every sheet as Excel draws it, or live.
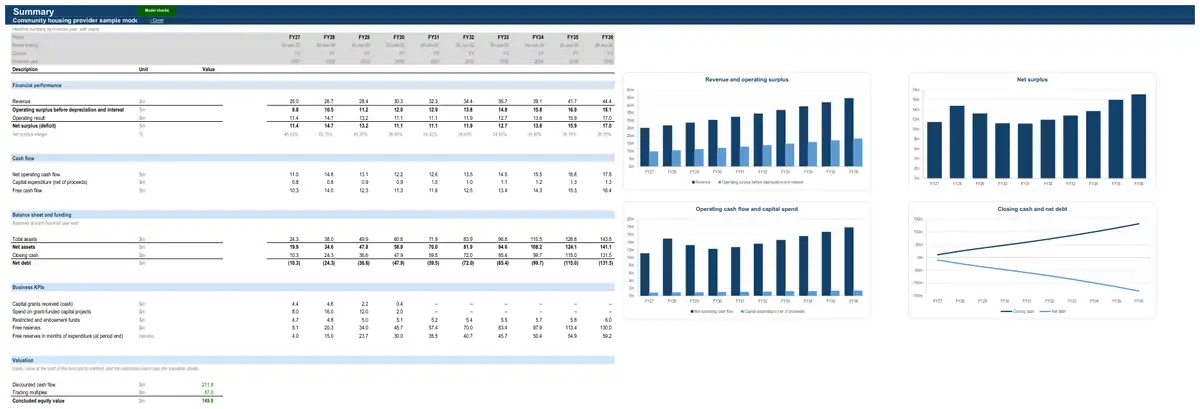
Illustrative figures: the sample describes no real business. The live preview shows values; your model’s Excel file has every formula.
How the model works for a community housing provider.
- How it earns revenue3 formulasRevenue (top-down) · The businessRevenueUnits soldAverage priceCapital grants and contributions · The businessClosing unspent capital grantsOpening unspent capital grantsCapital grants received (ahead of spend)Capital grants and contributions (income)Capital grants and contributions · The businessCapital works spend (all projects)Project 1 spendProject 2 spendProject 3 spendProject 4 spend
- What drives its costs1 formulaDirect costs (top-down) · The businessCost of salesRevenuefrom statementsGross margin
- What it invests in3 formulasCorporate fixed assetsCapital expenditureRevenuefrom statementsCapex as % of revenueAdditional planned capexCorporate fixed assetsDepreciationDepreciation of the opening asset baseDepreciation of new capexCorporate fixed assetsClosing net book valueOpening net book valueCapital expenditureDepreciation
- How it is funded2 formulasInterest-rate hedgingNet swap settlement (cost if positive)Hedged notionalSwap rate less base rateshare of the yearInterest-rate hedgingHedged notionalOpening borrowings (all facilities)Share of drawn debt hedged
- How profit becomes cash3 formulasWorking capitalTrade receivablesRevenuefrom statementsDebtor daysDays in periodWorking capitalInventoryDirect costs (positive)from statementsInventory daysDays in periodWorking capitalTrade payablesCash operating costs (positive)from statementsCreditor daysDays in period
12 parts, each one tested.
Every part is a tested building block with its own checks: yours is put together from the ones your business needs.
- CPI forecastConsensus curve with long-run anchor
- Revenue (top-down)Price × volume
- Direct costs (top-down)Gross margin %
- Corporate costsFixed cost base indexed to CPI
- Working capitalFull working capital
- Corporate fixed assetsStraight-line over remaining life
- Discounted cash flow valuationDCF on free cash flow to the firm
- Multiples valuationEV / EBITDA multiple
- Capital grants and contributionsFunding mix by capital projectGrants to build or acquire assets the entity will control, recognised as income as the asset is built (AASB 1058 paragraphs 15–16; a conditional-grant liability under IPSAS 23 and similar standards), with unspent amounts held as a liability and the income kept below the operating result. Used by councils, agencies, health services, charities, clubs and housing providers.
- Interest-rate hedgingHedged share at a fixed rate
- Reserves policy and restricted fundsFund roll-forwardFund balances by class — restricted, endowment, designated and general (free) reserves — and whether free reserves meet the reserves policy target.
- Interest-rate forecastMarket forward curve
The numbers it tracks.
- 01dwellings
- 02rent per dwelling
- 03CRA share of rent
- 04vacancy rate
- 05cost per dwelling
- 06EBITDA per dwelling
- 07interest cover
- 08gearing
- 09new supply pipeline
What it is used for.
- Budget and rolling forecastGuide · Cash flow forecast
- Operating forecastGuide · Financial projections
- Lending and credit analysisGuide · Three-statement model
- Development feasibilityGuide · Financial modelling services
- Project financeGuide · Financial modelling services
- Asset acquisition
- Scenarios and sensitivities
More in not-for-profits, clubs and member organisations.
- Charity financial model
- Licensed club financial model
- Sporting club financial model
- Industry association financial model
- Co-operative financial model
- Foundation and endowment financial model
- Indigenous corporation financial model
- Religious organisation financial model
Looking for a community housing provider financial model template? Ours arrives built for your business, with your figures in it.
See a finished model, sheet by sheetThe sample is built on illustrative figures and describes no real business. Models are calculations prepared from the information you provide. They are not financial advice and must be independently verified. See our terms.