Rural services agency financial model, built free.
A three-statement Excel model for a rural services and livestock agency, built from your own figures and checked to balance.
- Free account
- No card
- Usually ready within the hour
We use generative AI in parts of our process, so mistakes can occur. Every model should be checked by a person before it is relied on. Read more
Sells livestock and wool for farmers as agent, brokers rural real estate, runs saleyards and online auctions and retails rural merchandise, fertiliser and animal health, earning commissions that follow herd cycles, prices and the season.
In short
- 01
Three linked statements
Income statement, balance sheet and cash flow, linked in every period.
- 02
Valued two ways
Discounted cash flow and trading multiples, side by side.
- 03
Monthly to annual
Monthly, quarterly, half-yearly or annual periods, for up to 30 years.
- 04
Checked every period
A Checks sheet shows the balance sheet balances and the cash reconciles.
The sample, as Excel draws it.
Built by the same system and checks as yours: its structure and its inputs, ready for your own figures.
The sample describes no real business. Yours is calibrated to your own figures, so its results are your business’s.
How the model works for a rural services agency.
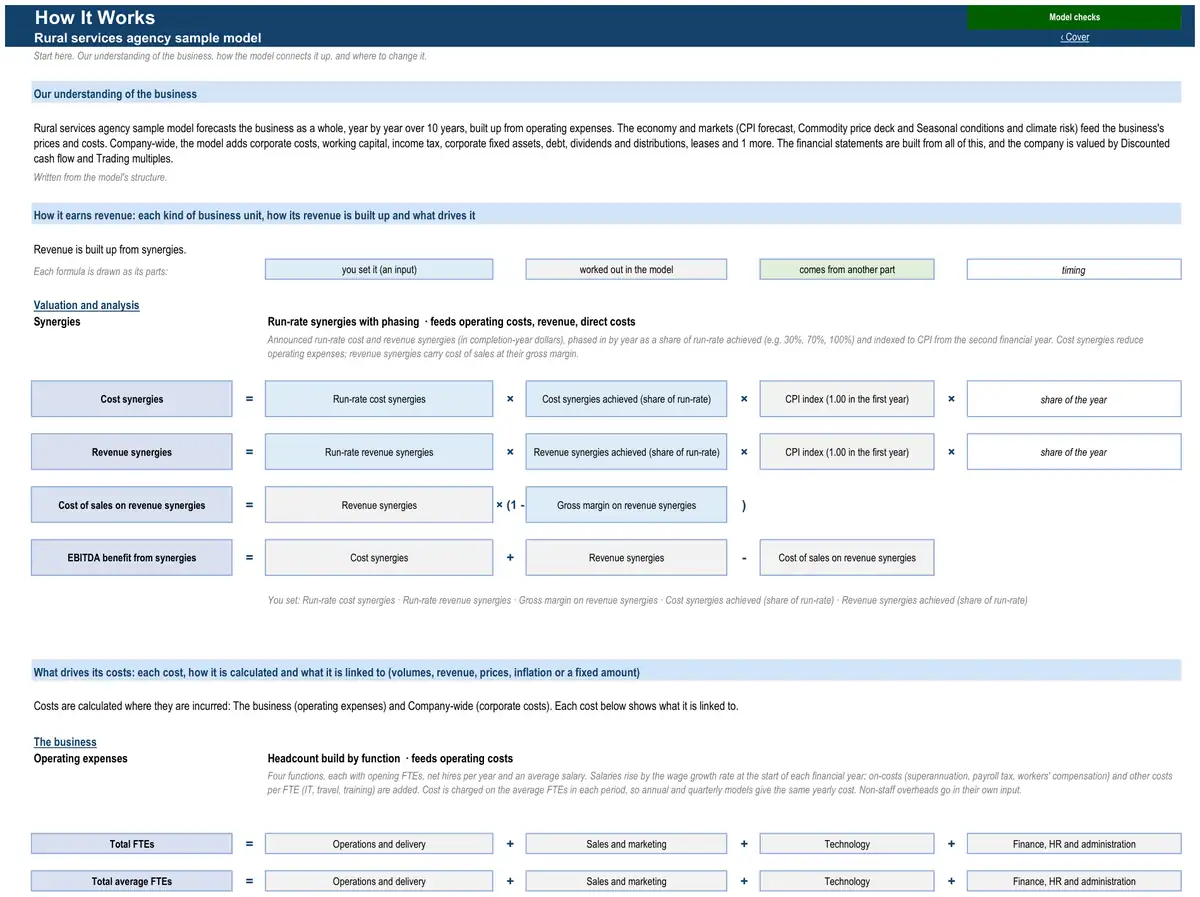
- How it earns revenue3 formulasSynergies · Valuation and analysisCost synergiesRun-rate cost synergiesCost synergies achieved (share of run-rate)CPI index (1.00 in the first year)share of the yearSynergies · Valuation and analysisRevenue synergiesRun-rate revenue synergiesRevenue synergies achieved (share of run-rate)CPI index (1.00 in the first year)share of the yearSynergies · Valuation and analysisCost of sales on revenue synergiesRevenue synergiesGross margin on revenue synergies
- What drives its costs3 formulasOperating expenses · The businessTotal FTEsOperations and deliverySales and marketingTechnologyFinance, HR and administrationOperating expenses · The businessTotal average FTEsOperations and deliverySales and marketingTechnologyFinance, HR and administrationOperating expenses · The businessTotal staff costsSalariesOn-costsOther costs per FTE
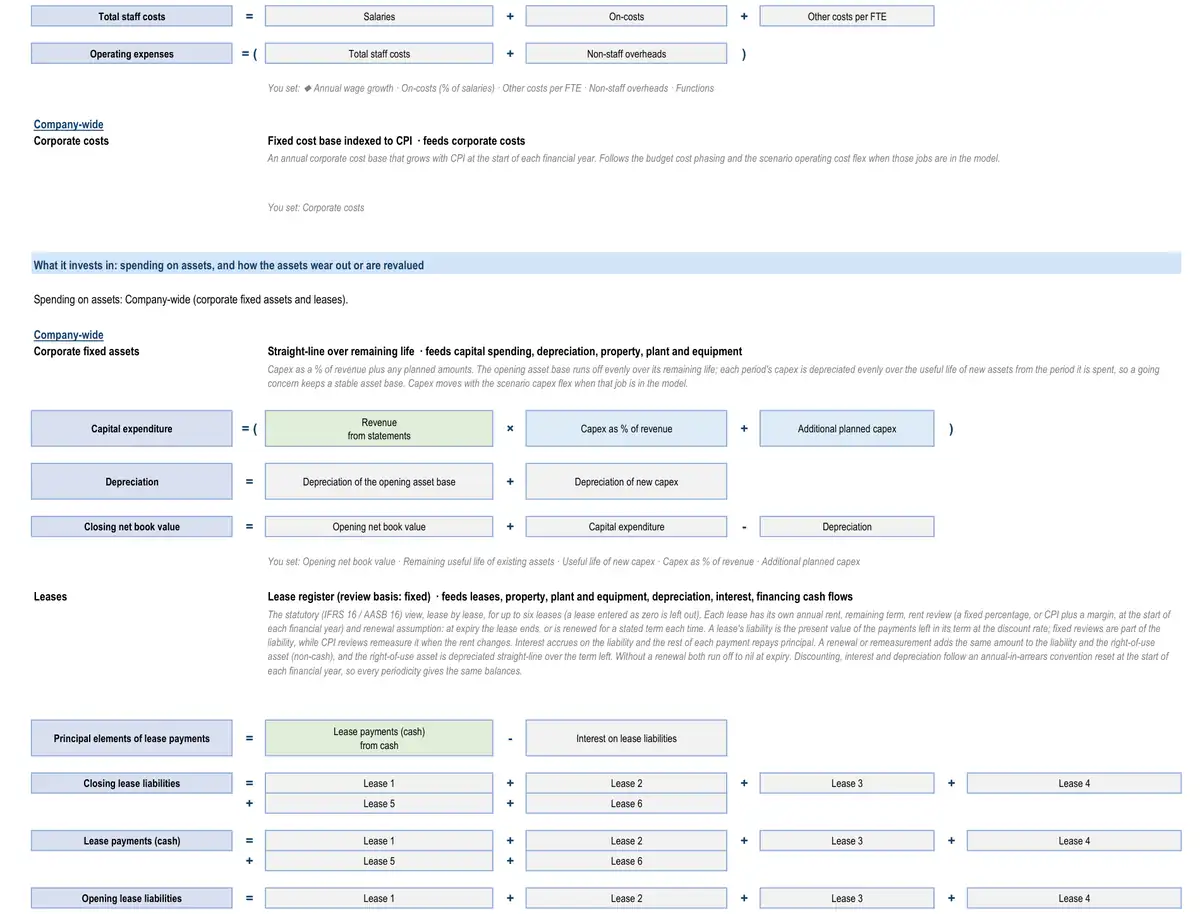
- What it invests in3 formulasCorporate fixed assetsCapital expenditureRevenuefrom statementsCapex as % of revenueAdditional planned capexCorporate fixed assetsDepreciationDepreciation of the opening asset baseDepreciation of new capexCorporate fixed assetsClosing net book valueOpening net book valueCapital expenditureDepreciation
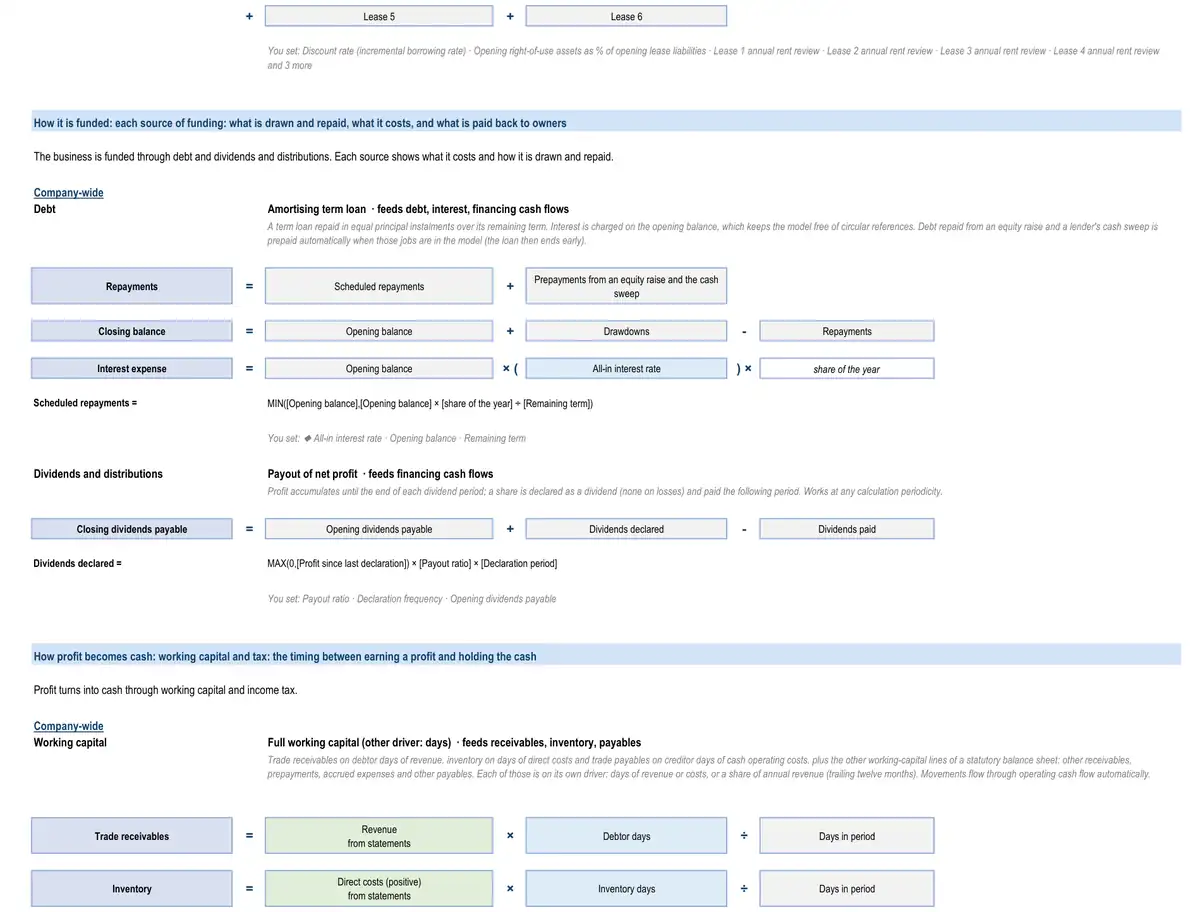
- How it is funded3 formulasDebtRepaymentsScheduled repaymentsPrepayments from an equity raise and the cash sweepDebtClosing balanceOpening balanceDrawdownsRepaymentsDebtInterest expenseOpening balanceAll-in interest rateshare of the year
- How profit becomes cash3 formulasWorking capitalTrade receivablesRevenuefrom statementsDebtor daysDays in periodWorking capitalInventoryDirect costs (positive)from statementsInventory daysDays in periodWorking capitalTrade payablesCash operating costs (positive)from statementsCreditor daysDays in period
17 parts, each one tested.
Every part is a tested building block with its own checks: yours is put together from the ones your business needs.
- CPI forecastConsensus curve with long-run anchor
- Operating expensesHeadcount build by function
- Corporate costsFixed cost base indexed to CPI
- Working capitalFull working capital
- Income taxCorporate rate with tax losses
- Corporate fixed assetsStraight-line over remaining life
- DebtAmortising term loan
- Dividends and distributionsPayout of net profit
- Discounted cash flow valuationDCF on free cash flow to the firm
- Multiples valuationEV / EBITDA multiple
- Commodity price deckFlat real pricesPrice paths for the farm, fish and forest commodities in the model — grain, oilseeds, cotton, sugar, beef, lamb, pork, wool, milk, fish, logs, fertiliser and feed — that sales and cost methods read as indices.
- Seasonal conditions and climate riskSeason type by yearA season factor that scales yields, carrying capacity, receivals, input demand (or, for ski resorts, snow and skier visits) for drought, average and good years.
- LeasesLease register
- Key-metric summaryLast-twelve-month and run-rate metrics
- Covenant tests and headroomLVR, gearing and ICR for property
- SynergiesRun-rate synergies with phasing
- Discount rate (WACC)CAPM at target gearing
The numbers it tracks.
- 01head and bales sold
- 02gross sales value
- 03commission rate
- 04merchandise sales
- 05EBIT by segment
- 06return on capital
More in farmland, agribusiness and rural services.
- Farmland investor financial model
- Farm management company financial model
- Agricultural contractor financial model
- Rural supplies distributor financial model
- Farm machinery dealer financial model
- Agtech company financial model
- Grain storage and handling financial model
- Grain trader financial model
Looking for a rural services agency financial model template? Ours arrives built for your business, with your figures in it.
See a finished model, sheet by sheetThe sample is built on illustrative figures and describes no real business. Models are calculations prepared from the information you provide. They are not financial advice and must be independently verified. See our terms.