FMCG brand financial model, built free.
A three-statement Excel model for a consumer brand (FMCG), built from your own figures and checked to balance.
- Free account
- No card
- Usually ready within the hour
We use generative AI in parts of our process, so mistakes can occur. Every model should be checked by a person before it is relied on. Read more
Makes or sources packaged food, snacks, sauces and other grocery products (the general case for FMCG brands not covered by a more specific brand type) and sells them through supermarkets, retailers, foodservice and export markets, earning gross margin after trade spend and advertising.
In short
- 01
Three linked statements
Income statement, balance sheet and cash flow, linked in every period.
- 02
Valued two ways
Discounted cash flow and trading multiples, side by side.
- 03
Monthly to annual
Monthly, quarterly, half-yearly or annual periods, for up to 30 years.
- 04
Checked every period
A Checks sheet shows the balance sheet balances and the cash reconciles.
The sample, as Excel draws it.
Built by the same system and checks as yours: its structure and its inputs, ready for your own figures.
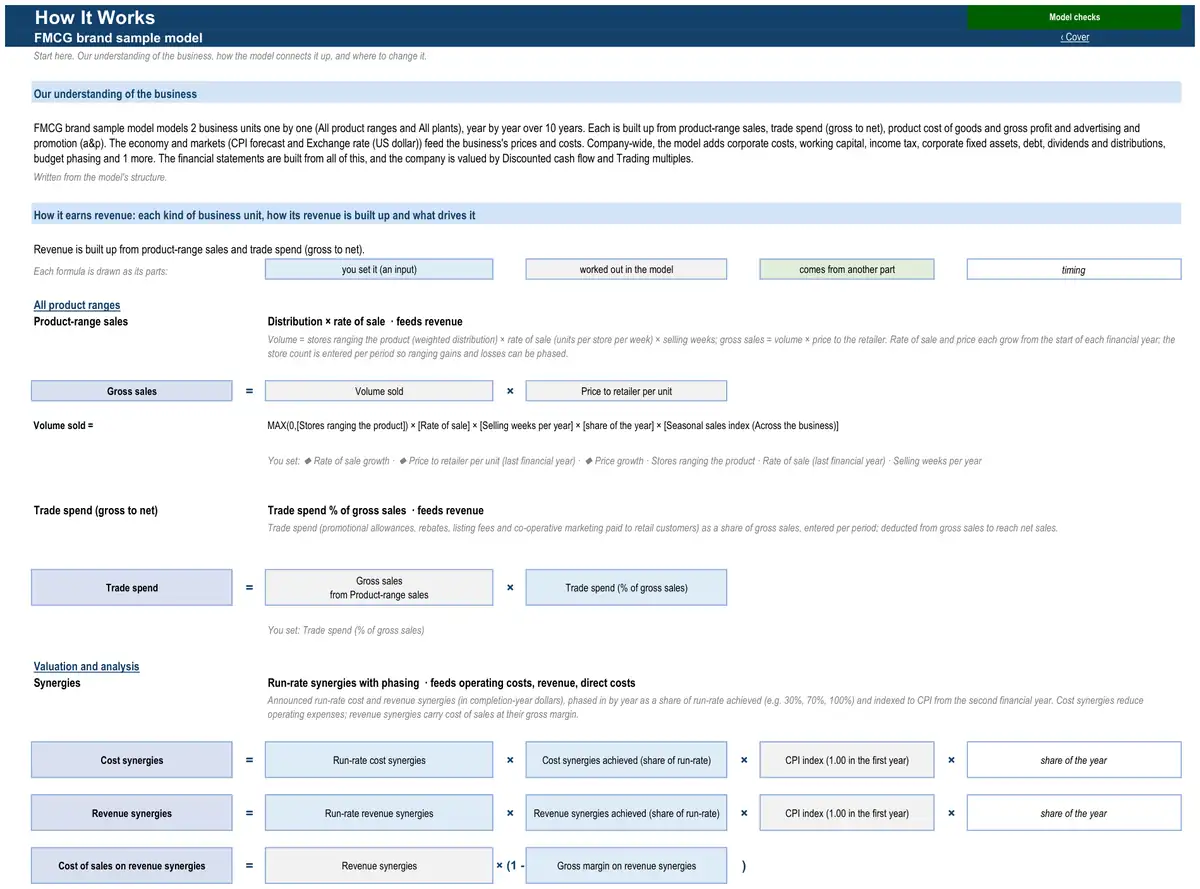
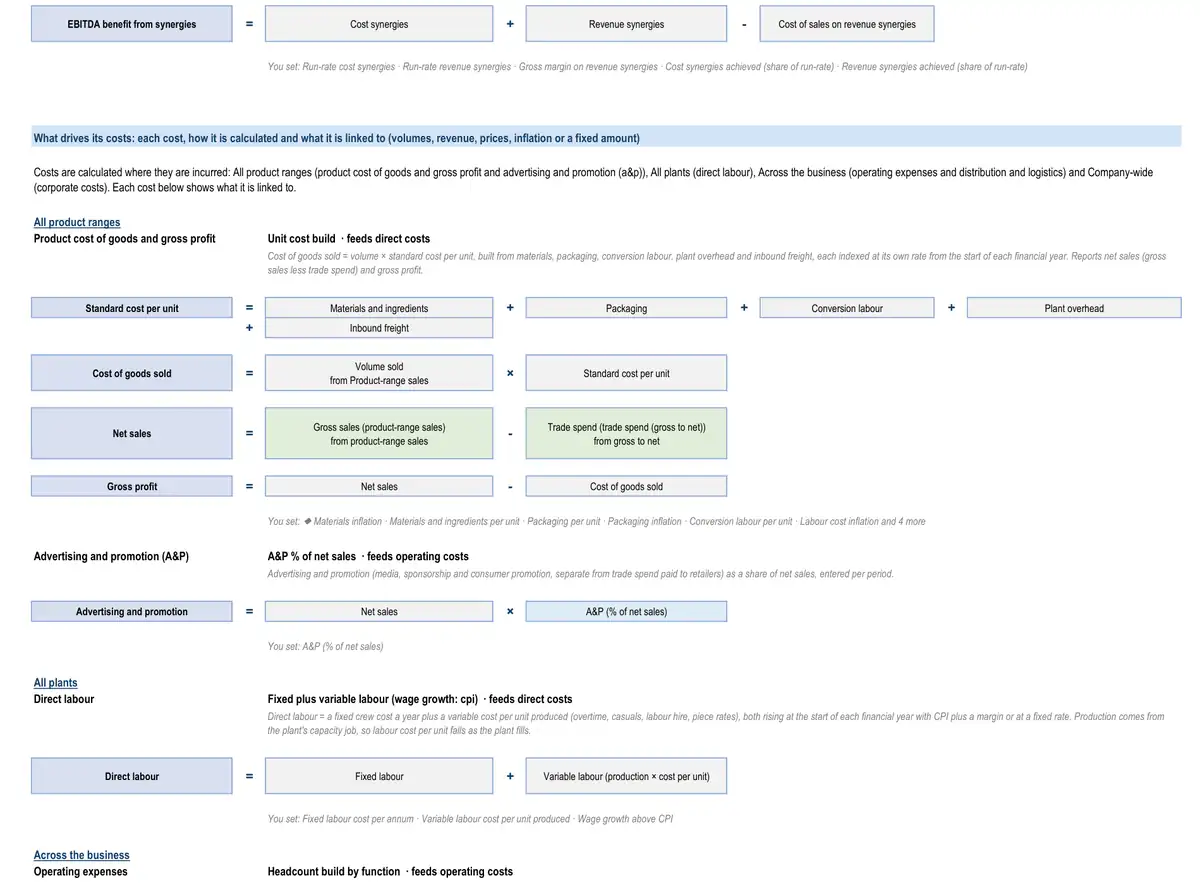
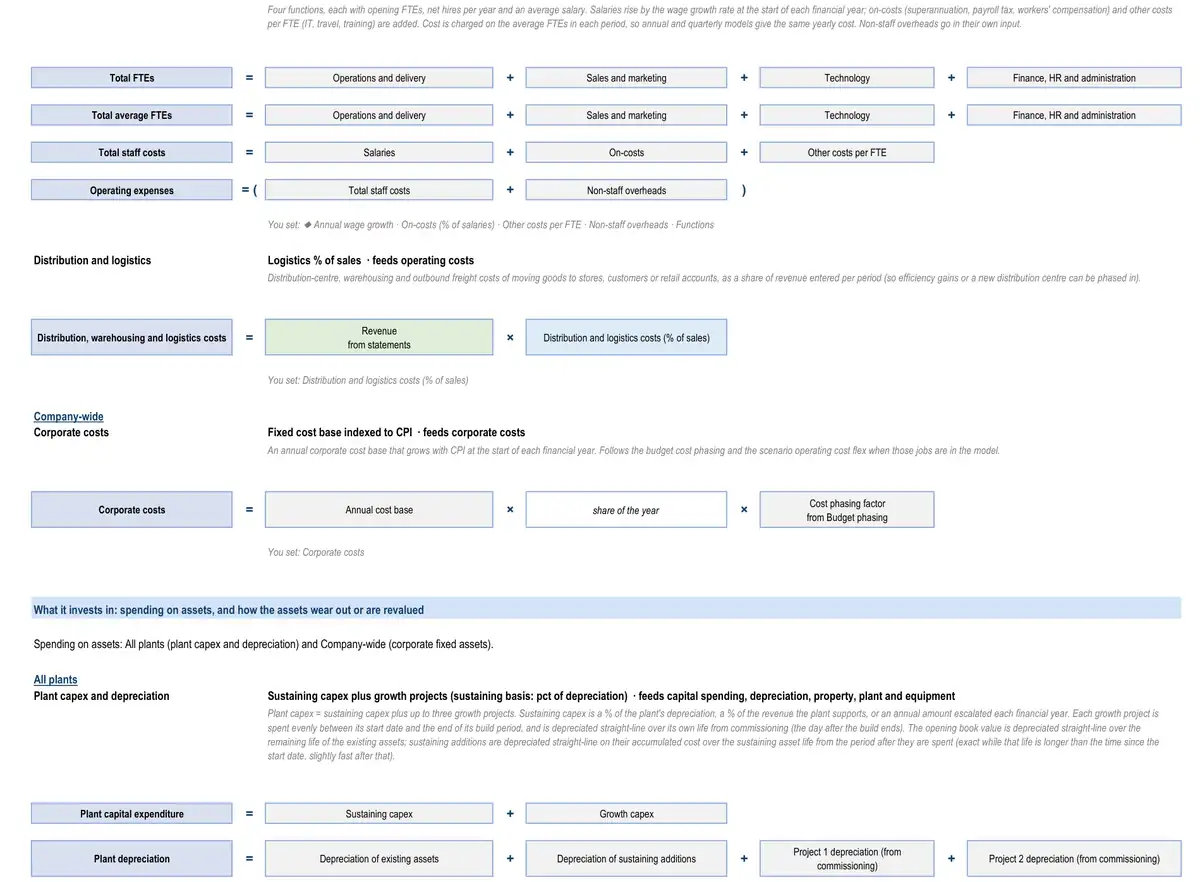
The sample describes no real business. Yours is calibrated to your own figures, so its results are your business’s.
How the model works for an FMCG brand.
- How it earns revenue3 formulasProduct-range sales · All product rangesGross salesVolume soldPrice to retailer per unitTrade spend (gross to net) · All product rangesTrade spendGross salesfrom product-range salesTrade spend (% of gross sales)Synergies · Valuation and analysisCost synergiesRun-rate cost synergiesCost synergies achieved (share of run-rate)CPI index (1.00 in the first year)share of the year
- What drives its costs3 formulasProduct cost of goods and gross profit · All product rangesStandard cost per unitMaterials and ingredientsPackagingConversion labourPlant overheadInbound freightProduct cost of goods and gross profit · All product rangesCost of goods soldVolume soldfrom product-range salesStandard cost per unitProduct cost of goods and gross profit · All product rangesNet salesGross sales (product-range sales)from product-range salesTrade spend (trade spend (gross to net))from gross to net
- What it invests in3 formulasPlant capex and depreciation · All plantsPlant capital expenditureSustaining capexGrowth capexPlant capex and depreciation · All plantsPlant depreciationDepreciation of existing assetsDepreciation of sustaining additionsProject 1 depreciation (from commissioning)Project 2 depreciation (from commissioning)Project 3 depreciation (from commissioning)Plant capex and depreciation · All plantsClosing net book valueOpening net book valuePlant capital expenditurePlant depreciation
- How it is funded3 formulasDebtRepaymentsScheduled repaymentsPrepayments from an equity raise and the cash sweepDebtClosing balanceOpening balanceDrawdownsRepaymentsDebtInterest expenseOpening balanceAll-in interest rateshare of the year
- How profit becomes cash3 formulasWorking capitalTrade receivablesRevenuefrom statementsDebtor daysDays in periodWorking capitalInventoryDirect costs (positive)from statementsInventory daysDays in periodWorking capitalTrade payablesCash operating costs (positive)from statementsCreditor daysDays in period
29 parts, each one tested.
Every part is a tested building block with its own checks: yours is put together from the ones your business needs.
- CPI forecastConsensus curve with long-run anchor
- Exchange rate (US dollar)Exchange rate by financial year
- Operating expensesHeadcount build by function
- Corporate costsFixed cost base indexed to CPI
- Working capitalFull working capital
- Income taxCorporate rate with tax losses
- Corporate fixed assetsStraight-line over remaining life
- DebtAmortising term loan
- Dividends and distributionsPayout of net profit
- Discounted cash flow valuationDCF on free cash flow to the firm
- Multiples valuationEV / EBITDA multiple
- Key-metric summaryLast-twelve-month and run-rate metrics
- Budget phasingSeasonal profile of twelve monthly weights
- Covenant tests and headroomLVR, gearing and ICR for property
- Sources and uses at completionEntry multiple with debt sized in turns of EBITDA
- Management equity and ratchetsFixed management share or option pool
- Exit valuation and timingExit multiple of LTM EBITDA
- Sponsor returns and value creationValue creation bridge
- SynergiesRun-rate synergies with phasing
- Discount rate (WACC)CAPM at target gearing
- Seasonal phasing of salesHistorical monthly profileHow annual sales — and the stock and cash that follow them — are spread across months or quarters.
- Distribution and logisticsLogistics % of salesDistribution-centre, warehousing and outbound freight costs of moving goods to stores, customers or retail accounts.
- Product-range salesDistribution × rate of saleGross sales of a brand, category or SKU family to retailers, wholesale accounts and export markets.
- Trade spend (gross to net)Trade spend % of gross salesPayments and discounts to retail customers — promotional allowances, rebates, listing fees and co-operative marketing — deducted from gross sales to reach net revenue.
- Product cost of goods and gross profitUnit cost buildCost of making or buying each product range — materials, packaging, conversion and inbound freight.
- Advertising and promotion (A&P)A&P % of net salesBrand investment in media, sponsorship and consumer promotion (separate from trade spend paid to retailers).
- Capacity and productionOperating days × daily rate
- Direct labourFixed plus variable labour
- Plant capex and depreciationSustaining capex plus growth projects
The numbers it tracks.
- 01volume growth
- 02net sales per unit
- 03price and mix
- 04gross margin %
- 05trade spend % of gross sales
- 06A&P % of net sales
- 07EBIT margin
What it is used for.
- Operating forecastGuide · Financial projections
- Budget and rolling forecastGuide · Cash flow forecast
- ValuationGuide · DCF valuation model
- Lending and credit analysisGuide · Three-statement model
- Merger or acquisition (strategic)Guide · Financial modelling services
- Leveraged buyout (private equity)Guide · Financial modelling services
More in consumer brands.
- Fashion brand financial model
- Luxury goods house financial model
- Beauty brand financial model
- Household products brand financial model
- Consumer electronics brand financial model
- Leisure products brand financial model
- Private-label manufacturer financial model
- Brand licensing company financial model
Looking for an FMCG brand financial model template? Ours arrives built for your business, with your figures in it.
Running a small business? Read what goes into a small business financial model.
See a finished model, sheet by sheetThe sample is built on illustrative figures and describes no real business. Models are calculations prepared from the information you provide. They are not financial advice and must be independently verified. See our terms.