Luxury goods house financial model, built free.
A three-statement Excel model for a luxury goods house, built from your own figures and checked to balance.
- Free account
- No card
- Usually ready within the hour
We use generative AI in parts of our process, so mistakes can occur. Every model should be checked by a person before it is relied on. Read more
Owns one or more luxury maisons — fashion and leather goods, watches and jewellery, wines and spirits, perfumes and cosmetics — sold mainly through directly operated boutiques, selective wholesale and travel retail, with pricing power, heavy brand investment and results reported at constant currency.
In short
- 01
Three linked statements
Income statement, balance sheet and cash flow, linked in every period.
- 02
Valued three ways
Discounted cash flow, trading multiples and sum of the parts, side by side.
- 03
Monthly to annual
Monthly, quarterly, half-yearly or annual periods, for up to 30 years.
- 04
Checked every period
A Checks sheet shows the balance sheet balances and the cash reconciles.
The sample, as Excel draws it.
Built by the same system and checks as yours, on illustrative figures: every sheet as Excel draws it, or live.
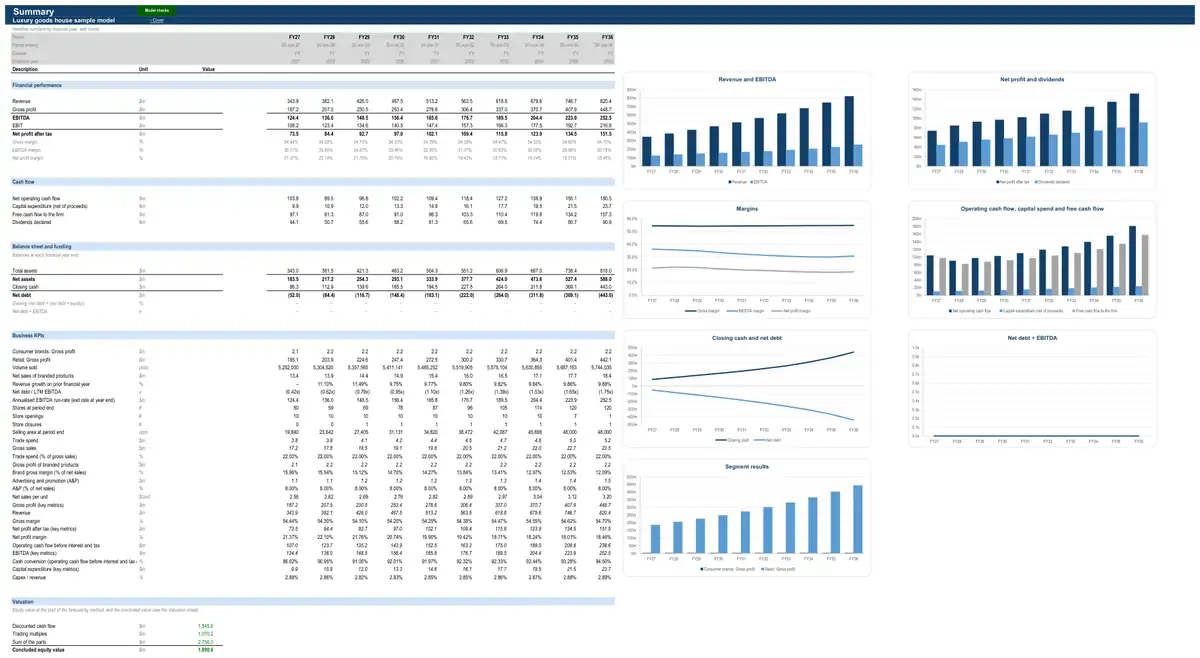
Illustrative figures: the sample describes no real business. The live preview shows values; your model’s Excel file has every formula.
How the model works for a luxury goods house.
- How it earns revenue3 formulasProduct-range sales · All product rangesGross salesVolume soldPrice to retailer per unitTrade spend (gross to net) · All product rangesTrade spendGross salesfrom product-range salesTrade spend (% of gross sales)Sales · All store formatsOnline salesOrdersAverage order value
- What drives its costs3 formulasProduct cost of goods and gross profit · All product rangesStandard cost per unitMaterials and ingredientsPackagingConversion labourPlant overheadInbound freightProduct cost of goods and gross profit · All product rangesCost of goods soldVolume soldfrom product-range salesStandard cost per unitProduct cost of goods and gross profit · All product rangesNet salesGross sales (product-range sales)from product-range salesTrade spend (trade spend (gross to net))from gross to net
- What it invests in3 formulasStore capex and depreciation · All store formatsCapital expenditureOnline salesfrom salesCapex as % of salesStore capex and depreciation · All store formatsLess depreciationDepreciation (run-off of a mix of vintages)DepreciationStore capex and depreciation · All store formatsClosing net book valueOpening net book valueAdd capital expenditureLess depreciation
- How it is funded3 formulasDebtRepaymentsScheduled repaymentsPrepayments from an equity raise and the cash sweepDebtClosing balanceOpening balanceDrawdownsRepaymentsDebtInterest expenseOpening balanceAll-in interest rateshare of the year
- How profit becomes cash3 formulasWorking capitalTrade receivablesRevenuefrom statementsDebtor daysDays in periodWorking capitalInventoryDirect costs (positive)from statementsInventory daysDays in periodWorking capitalTrade payablesCash operating costs (positive)from statementsCreditor daysDays in period
28 parts, each one tested.
Every part is a tested building block with its own checks: yours is put together from the ones your business needs.
- CPI forecastConsensus curve with long-run anchor
- Exchange rate (US dollar)Exchange rate by financial year
- Operating expensesHeadcount build by function
- Corporate costsFixed cost base indexed to CPI
- Working capitalFull working capital
- Income taxCorporate rate with tax losses
- DebtAmortising term loan
- Dividends and distributionsPayout of net profit
- Discounted cash flow valuationDCF on free cash flow to the firm
- Multiples valuationEV / EBITDA multiple
- LeasesLease register
- Key-metric summaryLast-twelve-month and run-rate metrics
- Purchase price allocationAcquired intangibles with deferred tax
- SynergiesRun-rate synergies with phasing
- Case selectionStackable stress toggles
- Discount rate (WACC)CAPM at target gearing
- Sum of the partsRegister of parts on mixed bases
- InventoryStock per store plus DC stockStock held in stores, distribution centres and in transit, and the cash it ties up.
- Enterprise value to equity bridgeNet debt at the valuation date
- Product-range salesDistribution × rate of saleGross sales of a brand, category or SKU family to retailers, wholesale accounts and export markets.
- Trade spend (gross to net)Trade spend % of gross salesPayments and discounts to retail customers — promotional allowances, rebates, listing fees and co-operative marketing — deducted from gross sales to reach net revenue.
- Product cost of goods and gross profitUnit cost buildCost of making or buying each product range — materials, packaging, conversion and inbound freight.
- Advertising and promotion (A&P)A&P % of net salesBrand investment in media, sponsorship and consumer promotion (separate from trade spend paid to retailers).
- Store networkRoll-out to a target networkStores trading in each period — openings, closures and selling area — which every per-store driver multiplies.
- SalesOnline sales from active customers × orders × order valueSales of the format — stores, restaurants, cafés or an online channel — the revenue base of every retailer.
- Cost of goods soldProduct margin less shrinkage and freightCost of the goods (or food) sold by the format, after supplier terms, freight, markdowns and shrinkage.
- Store and channel operating costsPer-store wages, rent and other costsCosts of running the format — store wages, rent and occupancy, running costs, or an online channel's fulfilment and platform costs (rent here is the pre-AASB 16 cash view).
- Store capex and depreciationCapex as % of salesFit-out spend on new stores, refurbishments and maintenance, and the depreciation and book value of store assets.
The numbers it tracks.
- 01organic growth at constant currency
- 02price and mix
- 03retail share of sales
- 04gross margin %
- 05marketing % of sales
- 06EBIT margin by maison
What it is used for.
- Operating forecastGuide · Financial projections
- ValuationGuide · DCF valuation model
- Merger or acquisition (strategic)Guide · Financial modelling services
- Scenarios and sensitivities
More in consumer brands.
- FMCG brand financial model
- Fashion brand financial model
- Beauty brand financial model
- Household products brand financial model
- Consumer electronics brand financial model
- Leisure products brand financial model
- Private-label manufacturer financial model
- Brand licensing company financial model
Looking for a luxury goods house financial model template? Ours arrives built for your business, with your figures in it.
Running a small business? Read what goes into a small business financial model.
See a finished model, sheet by sheetThe sample is built on illustrative figures and describes no real business. Models are calculations prepared from the information you provide. They are not financial advice and must be independently verified. See our terms.