LPG distributor financial model, built free.
A three-statement Excel model for an LPG and propane distributor, built from your own figures and checked to balance.
- Free account
- No card
- Usually ready within the hour
We use generative AI in parts of our process, so mistakes can occur. Every model should be checked by a person before it is relied on. Read more
Sources LPG or propane and delivers it in bulk tanks and cylinders to homes, businesses and autogas sites, earning a unit margin on volumes that swing with winter heating demand, plus tank and cylinder rental.
In short
- 01
Three linked statements
Income statement, balance sheet and cash flow, linked in every period.
- 02
Valued two ways
Discounted cash flow and trading multiples, side by side.
- 03
Monthly to annual
Monthly, quarterly, half-yearly or annual periods, for up to 30 years.
- 04
Checked every period
A Checks sheet shows the balance sheet balances and the cash reconciles.
The sample, as Excel draws it.
Built by the same system and checks as yours, on illustrative figures: every sheet as Excel draws it, or live.
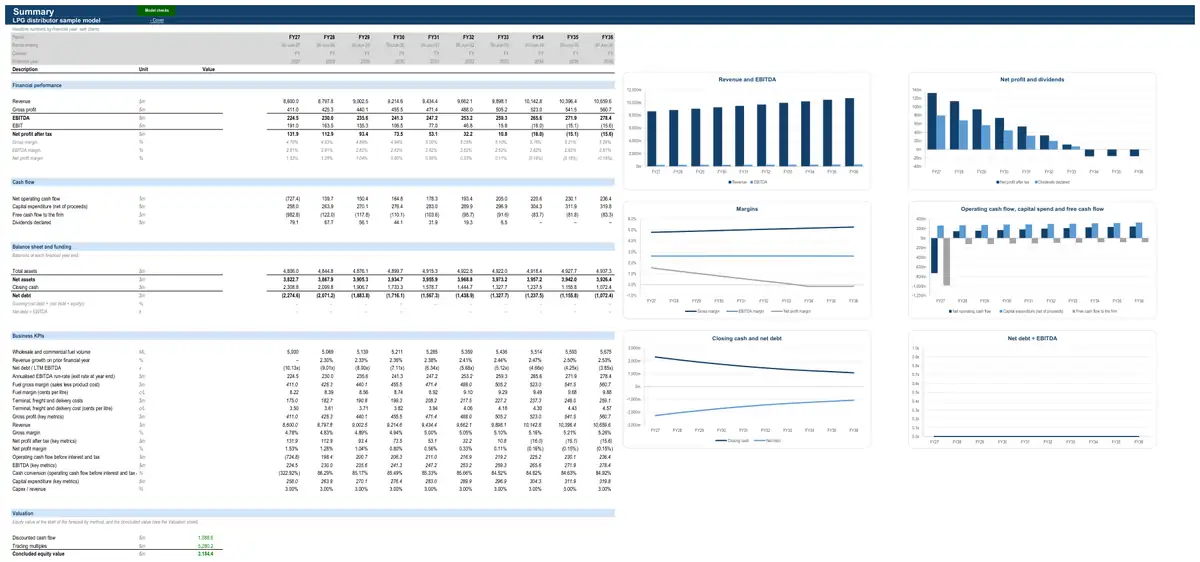
Illustrative figures: the sample describes no real business. The live preview shows values; your model’s Excel file has every formula.
How the model works for an LPG distributor.
- How it earns revenue3 formulasWholesale fuel revenue and product cost · The businessWholesale and commercial fuel salesWholesale and commercial fuel volumefrom wholesale and commercial fuel volumesSelling price per litreWholesale fuel revenue and product cost · The businessFuel product costWholesale and commercial fuel salesFuel gross marginWholesale fuel revenue and product cost · The businessFuel gross marginWholesale and reseller marginCommercial and mining marginAviation marginMarine marginDealer supply marginMargin on volume not split by channel (blended)
- What drives its costs3 formulasHydrocarbon inventory and price effects · The businessCrude and product inventoryCrude and feedstock stocksRefined product stocksOperating expenses · The businessTotal FTEsOperations and deliverySales and marketingTechnologyFinance, HR and administrationOperating expenses · The businessTotal average FTEsOperations and deliverySales and marketingTechnologyFinance, HR and administration
- What it invests in3 formulasCorporate fixed assetsCapital expenditureRevenuefrom statementsCapex as % of revenueAdditional planned capexCorporate fixed assetsDepreciationDepreciation of the opening asset baseDepreciation of new capexCorporate fixed assetsClosing net book valueOpening net book valueCapital expenditureDepreciation
- How it is funded3 formulasDebtRepaymentsScheduled repaymentsPrepayments from an equity raise and the cash sweepDebtClosing balanceOpening balanceDrawdownsRepaymentsDebtInterest expenseOpening balanceAll-in interest rateshare of the year
- How profit becomes cash3 formulasWorking capitalTrade receivablesRevenuefrom statementsDebtor daysDays in periodWorking capitalInventoryDirect costs (positive)from statementsInventory daysDays in periodWorking capitalTrade payablesCash operating costs (positive)from statementsCreditor daysDays in period
16 parts, each one tested.
Every part is a tested building block with its own checks: yours is put together from the ones your business needs.
- CPI forecastConsensus curve with long-run anchor
- Operating expensesHeadcount build by function
- Corporate costsFixed cost base indexed to CPI
- Working capitalFull working capital
- Income taxCorporate rate with tax losses
- Corporate fixed assetsStraight-line over remaining life
- DebtAmortising term loan
- Dividends and distributionsPayout of net profit
- Discounted cash flow valuationDCF on free cash flow to the firm
- Multiples valuationEV / EBITDA multiple
- Hydrocarbon inventory and price effectsDays of cover at replacement costCrude and product stocks and the gains or losses from valuing them at historical versus replacement cost when prices move.
- Wholesale and commercial fuel volumesVolumes by channelLitres (or tonnes or gallons) sold through wholesale, commercial, aviation, marine and dealer channels.
- Wholesale fuel revenue and product costVolume × price with margin in cents per litreRevenue from fuel sold outside the company's own sites and the cost of product, giving the distribution margin.
- Terminal, freight and delivery costsDistribution cost per litreThe cost of receiving, storing and delivering fuel — import terminals, road and rail freight, and bulk and cylinder delivery fleets.
- Key-metric summaryLast-twelve-month and run-rate metrics
- Discount rate (WACC)CAPM at target gearing
The numbers it tracks.
- 01volumes (tonnes or gallons)
- 02unit margin
- 03heating degree days versus normal
- 04customers and tanks
- 05EBITDA
- 06distribution cover
What it is used for.
- Operating forecastGuide · Financial projections
- Budget and rolling forecastGuide · Cash flow forecast
- ValuationGuide · DCF valuation model
- Lending and credit analysisGuide · Three-statement model
- Merger or acquisition (strategic)Guide · Financial modelling services
- Scenarios and sensitivities
More in oil and gas.
- Oil and gas producer financial model
- Oil and gas explorer financial model
- Integrated oil and gas company financial model
- LNG producer financial model
- Oil sands producer financial model
- Oil and gas royalty owner financial model
- Oilfield services company financial model
- Drilling contractor financial model
- Midstream pipeline operator financial model
- LNG import terminal financial model
- Oil refiner financial model
- Fuel distributor financial model
Looking for an LPG distributor financial model template? Ours arrives built for your business, with your figures in it.
See a finished model, sheet by sheetThe sample is built on illustrative figures and describes no real business. Models are calculations prepared from the information you provide. They are not financial advice and must be independently verified. See our terms.