Oil refiner financial model, built free.
A three-statement Excel model for an oil refiner, built from your own figures and checked to balance.
- Free account
- No card
- Usually ready within the hour
We use generative AI in parts of our process, so mistakes can occur. Every model should be checked by a person before it is relied on. Read more
Runs crude oil and other feedstocks through refineries to make petrol, diesel, jet fuel and other products, earning the gross refining margin between product prices and crude cost, less energy and operating costs, with major turnarounds every few years.
In short
- 01
Three linked statements
Income statement, balance sheet and cash flow, linked in every period.
- 02
Valued two ways
Discounted cash flow and trading multiples, side by side.
- 03
Monthly to annual
Monthly, quarterly, half-yearly or annual periods, for up to 30 years.
- 04
Checked every period
A Checks sheet shows the balance sheet balances and the cash reconciles.
The sample, as Excel draws it.
Built by the same system and checks as yours, on illustrative figures: every sheet as Excel draws it, or live.
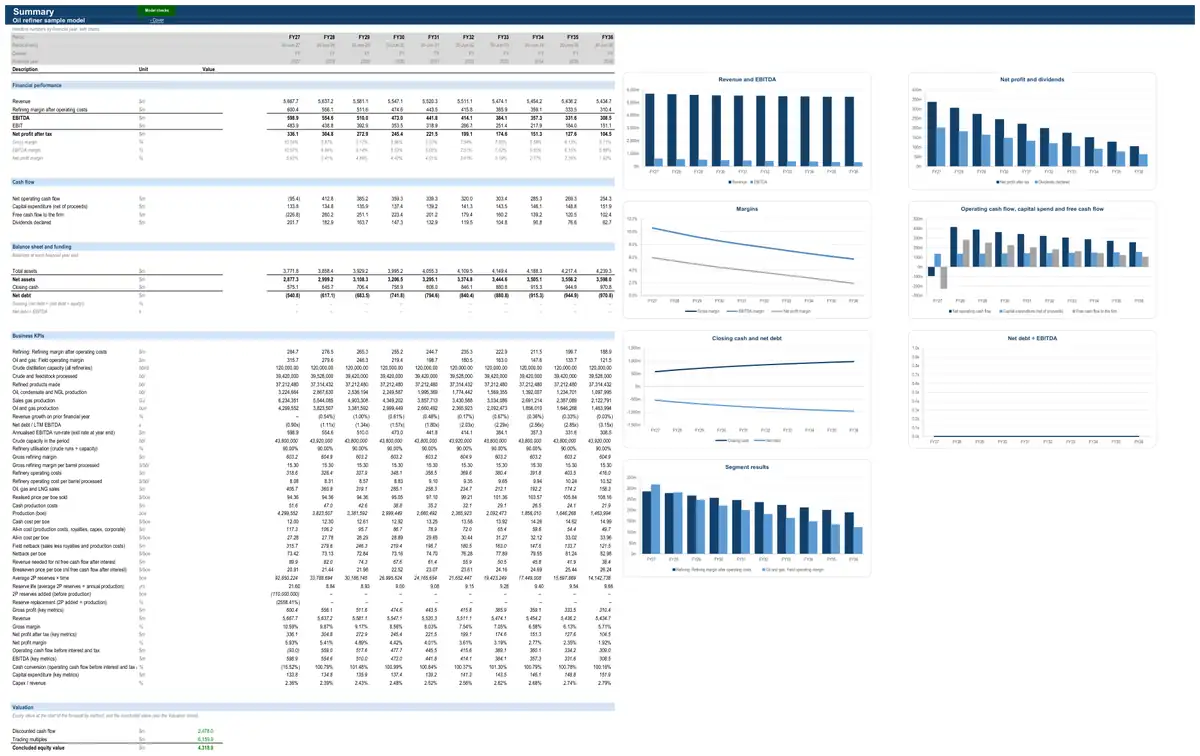
Illustrative figures: the sample describes no real business. The live preview shows values; your model’s Excel file has every formula.
How the model works for an oil refiner.
- How it earns revenue3 formulasRefining margin, product sales and crude cost · All refineriesCrude and feedstock costCrude and feedstock processedfrom crude runs and product yieldsDelivered crude costRefining margin, product sales and crude cost · All refineriesRefined product salesCrude and feedstock costGross refining marginOil, gas and LNG sales · Oil and gas asset 1Oil, gas and LNG salesOil, condensate and NGL salesGas sales
- What drives its costs3 formulasRefinery operating costs · All refineriesRefinery operating costsFixed refinery costsVariable refinery costsRoyalties and resource taxes · Oil and gas asset 1RoyaltiesWellhead valueRoyalty rateProduction costs · Oil and gas asset 1Production costsNet productionfrom productionProduction cost per boe
- What it invests in3 formulasRefinery capex, turnarounds and depreciation · All refineriesRefinery capexSustaining capexProject capexRefinery capex, turnarounds and depreciation · All refineriesClosing net book valueOpening net book valueRefinery capexDepreciationCapex, depletion and exploration · Oil and gas asset 1Development and sustaining capexSustaining capexGrowth capex
- How it is funded3 formulasDebtRepaymentsScheduled repaymentsPrepayments from an equity raise and the cash sweepDebtClosing balanceOpening balanceDrawdownsRepaymentsDebtInterest expenseOpening balanceAll-in interest rateshare of the year
- How profit becomes cash3 formulasWorking capitalTrade receivablesRevenuefrom statementsDebtor daysDays in periodWorking capitalInventoryDirect costs (positive)from statementsInventory daysDays in periodWorking capitalTrade payablesCash operating costs (positive)from statementsCreditor daysDays in period
25 parts, each one tested.
Every part is a tested building block with its own checks: yours is put together from the ones your business needs.
- CPI forecastConsensus curve with long-run anchor
- Exchange rate (US dollar)Exchange rate by financial year
- Corporate costsFixed cost base indexed to CPI
- Working capitalFull working capital
- Income taxCorporate rate with tax losses
- DebtAmortising term loan
- Dividends and distributionsPayout of net profit
- Discounted cash flow valuationDCF on free cash flow to the firm
- Multiples valuationEV / EBITDA multiple
- Hydrocarbon inventory and price effectsDays of cover at replacement costCrude and product stocks and the gains or losses from valuing them at historical versus replacement cost when prices move.
- Decommissioning and restoration provisionsPresent value with accretionProvisions to remove generation assets, abandon wells and restore sites — recognition, unwinding and spend.
- Energy and utility KPIsUpstream unit metricsThe ratios investors and lenders use to judge energy and utility businesses.
- Interest-rate hedgingHedged share at a fixed rate
- Key-metric summaryLast-twelve-month and run-rate metrics
- Discount rate (WACC)CAPM at target gearing
- Crude runs and product yieldsRefinery plan by monthCrude processed and the products made from it.
- Refining margin, product sales and crude costBenchmark margin × capture rateProduct revenue, crude and feedstock cost, and the gross refining margin between them.
- Refinery operating costsFixed plus variableCash operating costs, including energy and carbon.
- Refinery capex, turnarounds and depreciationSustaining capex, straight-lineSustaining and project capex, capitalised turnarounds and depreciation.
- Field and project registerInterest, reserves and book valueWorking interest, reserves and carrying value of each field or LNG project.
- ProductionExponential declineOil, gas and LNG volumes produced each period (net to the company's interest).
- Oil, gas and LNG salesBenchmark × differential by productRealised prices × volumes for oil, condensate, gas and LNG.
- Royalties and resource taxesRoyalty on wellhead valueGovernment and private royalties, production sharing and petroleum resource taxes.
- Production costsCost per boeLifting, processing, transport and liquefaction costs.
- Capex, depletion and explorationUnits-of-production depletionDevelopment and sustaining capex, exploration spend, and depletion of oil and gas properties.
The numbers it tracks.
- 01crude throughput (bbl/d)
- 02utilisation
- 03gross refining margin per bbl
- 04cash opex per bbl
- 05inventory gains and losses
- 06replacement-cost EBITDA
What it is used for.
- Operating forecastGuide · Financial projections
- Budget and rolling forecastGuide · Cash flow forecast
- ValuationGuide · DCF valuation model
- Lending and credit analysisGuide · Three-statement model
- Restructuring and liquidityGuide · Financial modelling services
- Scenarios and sensitivities
More in oil and gas.
- Oil and gas producer financial model
- Oil and gas explorer financial model
- Integrated oil and gas company financial model
- LNG producer financial model
- Oil sands producer financial model
- Oil and gas royalty owner financial model
- Oilfield services company financial model
- Drilling contractor financial model
- Midstream pipeline operator financial model
- LNG import terminal financial model
- Fuel distributor financial model
- LPG distributor financial model
Looking for an oil refiner financial model template? Ours arrives built for your business, with your figures in it.
See a finished model, sheet by sheetThe sample is built on illustrative figures and describes no real business. Models are calculations prepared from the information you provide. They are not financial advice and must be independently verified. See our terms.