Private credit fund financial model, built free.
A three-statement Excel model for a private credit fund or business development company, built from your own figures and checked to balance.
- Free account
- No card
- Usually ready within the hour
We use generative AI in parts of our process, so mistakes can occur. Every model should be checked by a person before it is relied on. Read more
Listed or unlisted vehicle lending to mid-market companies (senior, unitranche and mezzanine loans), earning floating-rate interest and fees, using fund-level leverage and paying an external manager base and incentive fees, with most income distributed.
In short
- 01
Three linked statements
Income statement, balance sheet and cash flow, linked in every period.
- 02
Valued two ways
Discounted cash flow and net asset value, side by side.
- 03
Monthly to annual
Monthly, quarterly, half-yearly or annual periods, for up to 30 years.
- 04
Checked every period
A Checks sheet shows the balance sheet balances and the cash reconciles.
The sample, as Excel draws it.
Built by the same system and checks as yours, on illustrative figures: every sheet as Excel draws it, or live.
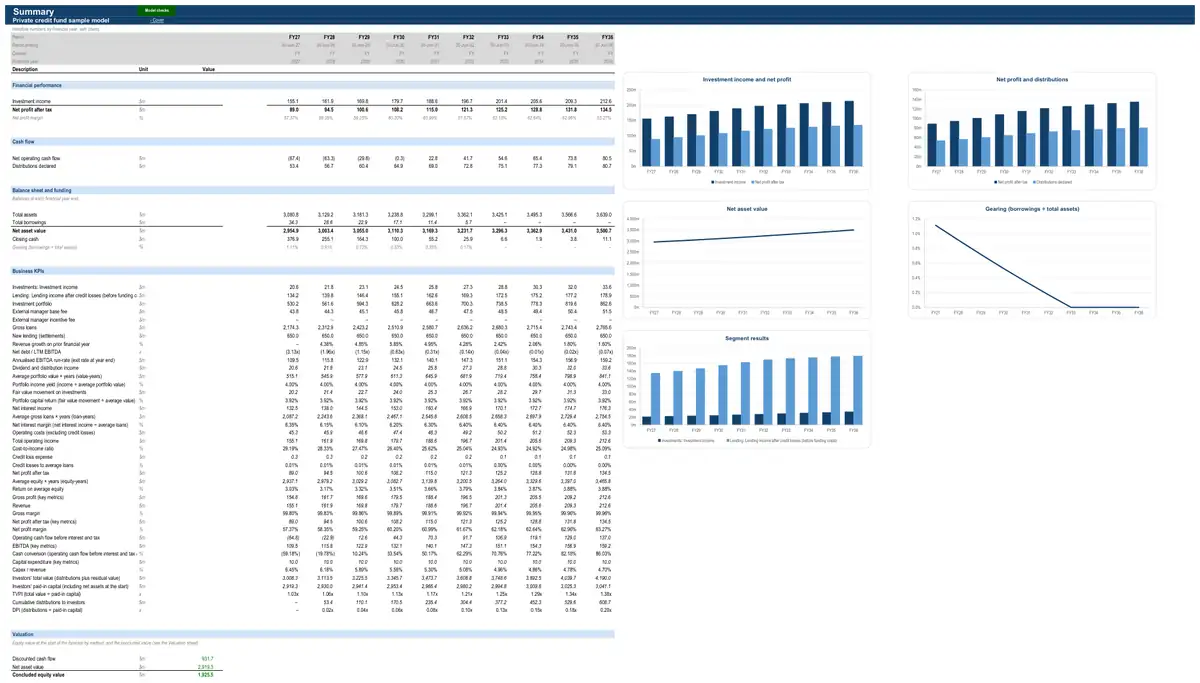
Illustrative figures: the sample describes no real business. The live preview shows values; your model’s Excel file has every formula.
How the model works for a private credit fund.
- How it earns revenue3 formulasInvestment holdings · All investeesMarket value at the end of the periodMarket value at the start of the periodNet purchases / (sales) of investmentsFair value movementInvestment holdings · All investeesDividend and distribution incomeAverage market value × yearsDividend and distribution yield (per year)Investment holdings · All investeesAverage market value × yearsMarket value at the start of the periodMarket value at the end of the periodshare of the year
- What drives its costs3 formulasExpected credit loss and write-offs · All loan portfoliosClosing allowanceClosing gross loansfrom loan origination and runoffExpected loss rate (Σ share × PD × shortfall, a year)Years of expected losses held in the allowanceExpected credit loss and write-offs · All loan portfoliosCredit loss expense (write-offs + change in allowance)Write-offs (net of recoveries)Closing allowanceOpening allowanceExpected credit loss and write-offs · All loan portfoliosWrite-offs (net of recoveries)Average gross loansExpected loss rate (Σ share × PD × shortfall, a year)share of the year
- How it is funded3 formulasLoan origination and runoff · All loan portfoliosClosing gross loansOpening gross loansNew lending (settlements)Scheduled amortisationPrepayments and other runoff (including loans written off)Loan origination and runoff · All loan portfoliosNet loans advanced (new lending less cash repayments)Closing gross loansOpening gross loansWrite-offs (net of recoveries)from expected credit loss and write-offsDebtRepaymentsScheduled repaymentsPrepayments from an equity raise and the cash sweep
- How profit becomes cash3 formulasIncome taxClosing tax lossesOpening tax lossesLosses usedLosses addedIncome taxIncome tax expenseTaxable profitCorporate tax rateIncome taxClosing tax payableOpening tax payableIncome tax expenseTax paid
19 parts, each one tested.
Every part is a tested building block with its own checks: yours is put together from the ones your business needs.
- Corporate costsFixed cost base indexed to CPI
- Income taxCorporate rate with tax losses
- DebtAmortising term loan
- Equity raisingDistribution reinvestment plan
- Dividends and distributionsPayout of net profit
- Discounted cash flow valuationDCF on free cash flow to the firm
- Net asset valueBook net asset value
- External manager feesIncentive fee over a hurdleBase and incentive fees paid to an external manager by listed investment companies, mortgage REITs, BDCs and other externally managed vehicles.
- Lender and bank key metricsNIM bridge by driverNet interest margin, spread, cost-to-income ratio, loss rate and returns for banks and lenders, and their drivers.
- Key-metric summaryLast-twelve-month and run-rate metrics
- Investor returnsNet IRR, TVPI, DPI and RVPI
- Case selectionStackable stress toggles
- Interest-rate forecastMarket forward curve
- CPI forecastCPI glide path
- Investment holdingsMarket value growth × dividend yieldValue, income and fair-value movements of listed and unlisted investments held on balance sheet.
- Loan origination and runoffOriginations less runoffGross loans rolled forward from new lending, scheduled repayments, prepayments and write-offs.
- Loan yield and interest incomeBase rate plus marginInterest income earned on each portfolio from its yield, repricing and fees.
- Lending fees and chargesFee schedule by event and accountFee income on a loan portfolio — establishment and application fees, monthly account fees, line and commitment fees on undrawn limits, late and default fees, discount and service fees on invoice finance, and early repayment charges.
- Expected credit loss and write-offsCollateral shortfall on secured loansCredit loss expense, the expected credit loss allowance held against loans, and write-offs.
The numbers it tracks.
- 01portfolio at fair value
- 02weighted average yield
- 03non-accruals
- 04net investment income per unit
- 05NAV per unit
- 06leverage
- 07distribution yield
What it is used for.
- Operating forecastGuide · Financial projections
- ValuationGuide · DCF valuation model
- Equity capital raisingGuide · Startup financial model
- Lending and credit analysisGuide · Three-statement model
- Closed-end fund, syndicate or trust
- Scenarios and sensitivities
More in banking and lending.
- Bank financial model
- Credit union financial model
- Neobank financial model
- Non-bank lender financial model
- Consumer lender financial model
- Buy now pay later provider financial model
- Invoice finance lender financial model
- Equipment and auto finance company financial model
- Mortgage lender financial model
- Mortgage broker financial model
- Mortgage REIT financial model
- Pawnbroker and small-amount lender financial model
- Debt collection agency financial model
- Development bank financial model
Looking for a private credit fund financial model template? Ours arrives built for your business, with your figures in it.
See a finished model, sheet by sheetThe sample is built on illustrative figures and describes no real business. Models are calculations prepared from the information you provide. They are not financial advice and must be independently verified. See our terms.