Diversified property group financial model, built free.
A three-statement Excel model for a diversified property group, built from your own figures and checked to balance.
- Free account
- No card
- Usually ready within the hour
We use generative AI in parts of our process, so mistakes can occur. Every model should be checked by a person before it is relied on. Read more
A stapled or integrated group that owns an investment portfolio, develops residential and commercial property, and manages funds — the model combines all three activities.
In short
- 01
Three linked statements
Income statement, balance sheet and cash flow, linked in every period.
- 02
Valued three ways
Discounted cash flow, sum of the parts and net asset value, side by side.
- 03
Monthly to annual
Monthly, quarterly, half-yearly or annual periods, for up to 30 years.
- 04
Checked every period
A Checks sheet shows the balance sheet balances and the cash reconciles.
The sample, as Excel draws it.
Built by the same system and checks as yours, on illustrative figures: every sheet as Excel draws it, or live.
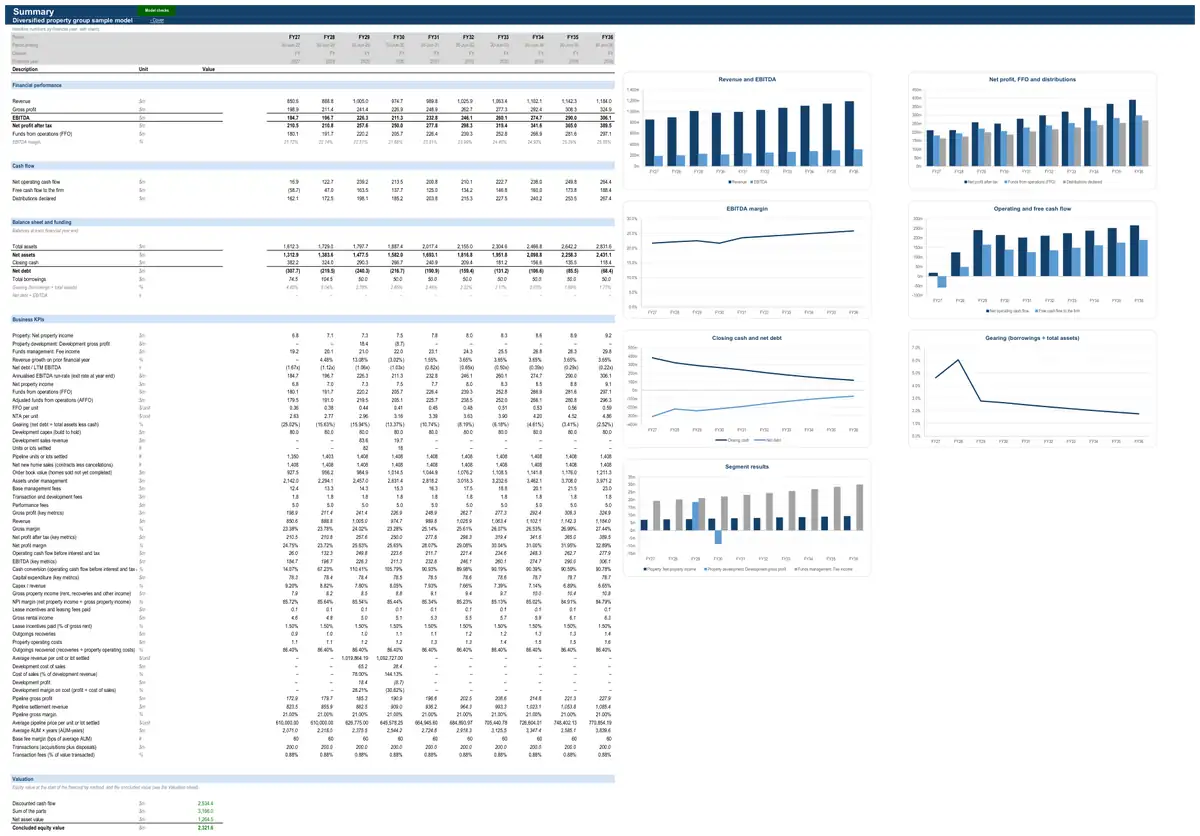
Illustrative figures: the sample describes no real business. The live preview shows values; your model’s Excel file has every formula.
How the model works for a diversified property group.
- How it earns revenue3 formulasRental income · All propertiesGross rental incomeLettable units or bedsMarket rent per unit per weekWeeks let per yearOccupancy (market-let units)share of the yearOutgoings recoveries · All propertiesOutgoings recoveriesProperty operating costsfrom property operating costsRecoverable share of operating costsOccupancy (market-let units)Other property income · All propertiesCar park incomeAverage occupied baysAverage rate per occupied bay per dayPaid days a yearshare of the year
- What drives its costs3 formulasProperty operating costs · All propertiesProperty operating costsStatutory charges (rates and land tax)Insurance, cleaning, security, repairs and utilitiesProperty management feeCost of sales and development inventory · All property developmentsClosing inventoryInventory available to releaseCost of sales (all remaining inventory once the last unit settles)Operating expenses · Across the businessOperating expensesStaff costs (annual)from annualMarketing (annual)from annualOccupancy (annual)from annualAdministration (annual)from annualshare of the year
- What it invests in1 formulaValuation · All propertiesClosing valueOpening valueMaintenance capex (capital expenditure)from capital expenditureFair value movement
- How it is funded3 formulasProject finance · All property developmentsProject debt drawn (share of costs)Land and development costs incurredShare of land and development costs funded by the loanProject finance · All property developmentsInterest on the average balance (rolled up and capitalised)Opening project debtProject debt drawn (share of costs)Repayment of the balance before interestAll-in interest rate (base rate plus margin and line fees)from base rate plus margin and line feesshare of the yearProject finance · All property developmentsClosing project debtDebt owing before repaymentProject debt repaid from settlements
- How profit becomes cash3 formulasWorking capitalTrade receivablesRevenuefrom statementsDebtor daysDays in periodWorking capitalInventoryDirect costs (positive)from statementsInventory daysDays in periodWorking capitalTrade payablesCash operating costs (positive)from statementsCreditor daysDays in period
44 parts, each one tested.
Every part is a tested building block with its own checks: yours is put together from the ones your business needs.
- CPI forecastCPI glide path
- Operating expensesOperating expense line items
- Corporate costsFixed cost base indexed to CPI
- Working capitalDays-based working capital
- Income taxFlow-through entity (no entity tax)
- DebtSingle debt facility
- Equity raisingDistribution reinvestment plan
- Dividends and distributionsPayout of FFO
- Discounted cash flow valuationDCF on free cash flow to the firm
- Net asset valueBook net asset value
- Interest-rate hedgingHedged share at a fixed rate
- Key-metric summaryLast-twelve-month and run-rate metrics
- Covenant tests and headroomLVR, gearing and ICR for property
- Discount rate (WACC)CAPM at target gearing
- Sum of the partsRegister of parts on mixed bases
- Tenant receivables, bad debts and depositsArrears days and bad debt %Rent arrears and bad debts, rent received in advance, and security deposits or bonds held for tenants — the property-specific working-capital balances.
- REIT metrics (FFO, AFFO, NTA, gearing)FFO and AFFO (Property Council of Australia)The earnings, balance-sheet and portfolio metrics investors use for property owners — FFO and AFFO, NTA per unit, gearing and covenant headroom, WALE and occupancy, like-for-like growth and rent cover.
- Acquisitions, disposals and capital recyclingCapital recycling programProperties bought and sold during the forecast — named transactions, generic acquisitions at an assumed yield, and disposals that recycle capital — with transaction costs and gains or losses on sale.
- Trust and REIT tax statusTaxable subsidiary or stapled companyThe tax rules that come with trust or REIT status — distribution requirements, taxable subsidiaries, tax-deferred distributions and withholding on property income paid to investors.
- Development pipeline (build to hold)Capex × yield on cost with revaluation on completionThe owner's pipeline of developments to hold — capital spent, completions, income added and development profit on revaluation — when projects are not modelled property by property.
- Development pipeline (top-down)Home sales, starts and completionsRevenue, margin and inventory for the developer's whole pipeline when projects are not modelled one by one — settlements by year, landbank run-off and capital employed.
- Interest-rate forecastFlat base rate
- Enterprise value to equity bridgeNet debt at the valuation date
- Property registerThe facts every other part of the model builds on — size, units, ownership share and opening value.
- Rental incomeUnits × weekly rent × occupancyBase rent earned from tenants and the occupancy that drives it.
- Property operating costsOutgoings budget by line itemOutgoings and other costs of running the property (rates, land tax, insurance, cleaning, security, repairs, management).
- Net property incomeFull income waterfallProperty-level income less property operating costs.
- Capital expenditureMaintenance capex as % of valueMaintenance, refurbishment and development spend added to the property's value.
- ValuationCapitalisation-rate valuation (fair value)Opening and closing property value and the fair value movement between them.
- Outgoings recoveriesFull recovery (triple net)Property operating costs recharged to tenants under net and semi-gross leases.
- Other property incomeCar park bays × rate × utilisationCar park, turnover rent, amenity fees, storage ancillaries and other income earned at the property.
- Lease incentives, leasing costs and straight-liningLeasing fees as % of first-year rentCash incentives, rent-free periods and leasing fees paid to secure tenants, and the non-cash adjustments that turn cash rent into statutory rent (incentive amortisation and straight-lining of fixed reviews).
- Project register and timelineSingle-stage projectUnits or lots, saleable area and the construction and completion timing every other part of the model uses.
- Land acquisition and holding costsUpfront purchase with holding costsThe land purchase, its payment terms, stamp duty and the holding costs (land tax, rates) until development.
- Development and construction costsTotal cost on an S-curveConstruction, professional fees, statutory contributions, marketing and contingency, and when they are spent.
- Sales, settlements and purchaser depositsPresales settling on completionUnits or lots sold (exchanged) and settled, the revenue recognised on settlement, and deposits received from buyers.
- Cost of sales and development inventoryForecast gross marginCapitalised land, construction and interest costs held as inventory and released to cost of sales as units settle.
- Project financeInterest on average spend, capitalisedConstruction and land loans at project level, with interest usually capitalised into inventory.
- Feasibility and project returnsResidual land valueThe project's profit, margin and return metrics used to approve and track the development.
- Assets under managementAUM with net flows and revaluation %The fund's assets under management over time — the base on which most fees are charged.
- Base management feesFee rate × average AUMRecurring fees charged on the fund's assets, equity or commitments.
- Transaction, development, property management and licence feesFee % × transaction volumeFees for acquisitions and disposals, equity raising, development management, property management and leasing, and brand licensing.
- Performance feesGuided performance feesFees earned when fund returns beat a benchmark or hurdle.
- Co-investment in managed fundsEquity-accounted share of fund earningsThe manager's own stake in the funds it manages and the income it earns from that stake.
The numbers it tracks.
- 01operating earnings per security
- 02segment EBIT
- 03FFO
- 04NTA per security
- 05gearing
- 06return on invested capital
What it is used for.
- Operating forecastGuide · Financial projections
- Budget and rolling forecastGuide · Cash flow forecast
- ValuationGuide · DCF valuation model
- Lending and credit analysisGuide · Three-statement model
- Equity capital raisingGuide · Startup financial model
- Development feasibilityGuide · Financial modelling services
- Merger or acquisition (strategic)Guide · Financial modelling services
- Scenarios and sensitivities
- Asset acquisition
More in property investment and REITs.
- Property investment company financial model
- Office REIT financial model
- Retail REIT (shopping centres) financial model
- Industrial and logistics REIT financial model
- Healthcare REIT financial model
- Net-lease REIT financial model
- Data centre REIT financial model
- Self-storage REIT financial model
- Hotel and resort REIT financial model
- Farmland REIT financial model
- Social infrastructure REIT financial model
- Cold storage property owner financial model
Looking for a diversified property group financial model template? Ours arrives built for your business, with your figures in it.
See a finished model, sheet by sheetThe sample is built on illustrative figures and describes no real business. Models are calculations prepared from the information you provide. They are not financial advice and must be independently verified. See our terms.