Farmland REIT financial model, built free.
A three-statement Excel model for a farmland and agricultural REIT, built from your own figures and checked to balance.
- Free account
- No card
- Usually ready within the hour
We use generative AI in parts of our process, so mistakes can occur. Every model should be checked by a person before it is relied on. Read more
Owns farms, water entitlements and agricultural infrastructure (glasshouses, feedlots, processing sites) leased to growers on long net leases, with rent set as a yield on value and reviewed by CPI, fixed steps or periodic revaluation, plus water leases and occasional crop-share arrangements.
In short
- 01
Three linked statements
Income statement, balance sheet and cash flow, linked in every period.
- 02
Valued two ways
Discounted cash flow and net asset value, side by side.
- 03
Monthly to annual
Monthly, quarterly, half-yearly or annual periods, for up to 30 years.
- 04
Checked every period
A Checks sheet shows the balance sheet balances and the cash reconciles.
The sample, as Excel draws it.
Built by the same system and checks as yours, on illustrative figures: every sheet as Excel draws it, or live.
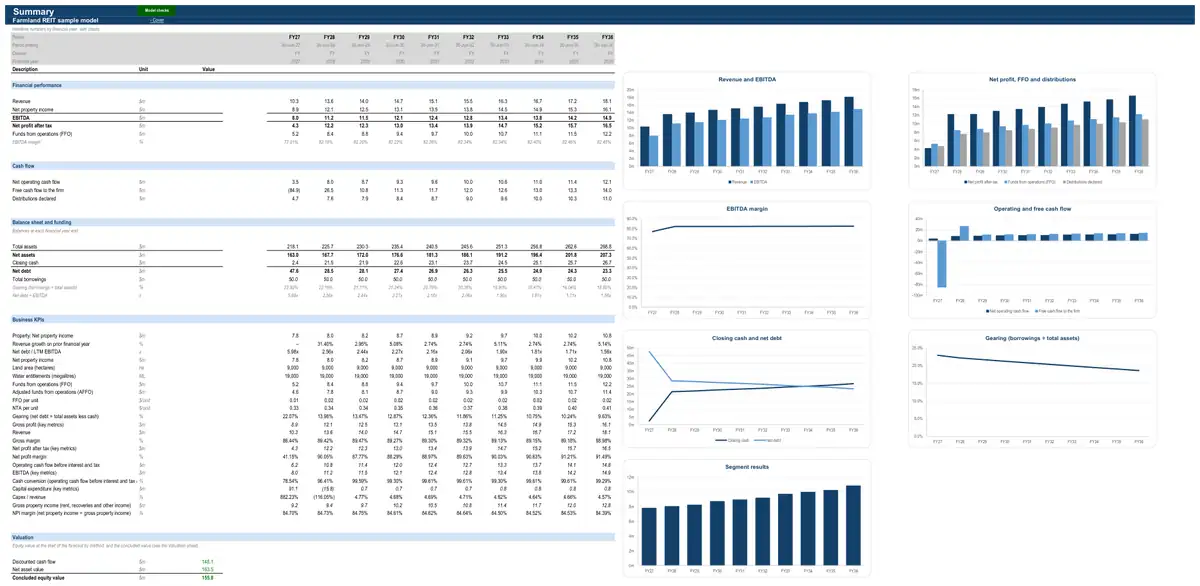
Illustrative figures: the sample describes no real business. The live preview shows values; your model’s Excel file has every formula.
How the model works for a farmland REIT.
- How it earns revenue3 formulasOther property income · All propertiesCar park incomeAverage occupied baysAverage rate per occupied bay per dayPaid days a yearshare of the yearAcquisitions, disposals and capital recycling · Across the businessPayments for acquisitions (including costs)Purchase price of properties acquiredStamp duty and acquisition costsAcquisitions, disposals and capital recycling · Across the businessProceeds from disposals (net of selling costs)Sale price of properties soldSelling costs
- What drives its costs3 formulasProperty operating costs · All propertiesProperty operating costsGross rental incomefrom rental incomeOperating costs as % of rental incomeTenant receivables, bad debts and depositsTenant receivablesTenant billings (rent, recoveries and other income)Tenant arrearsDays in periodCorporate costsManagement and corporate costsTotal assets at period startManagement expense ratioshare of the year
- What it invests in2 formulasValuation · All propertiesFair value movementValue (land + water + improvements)Opening valueMaintenance capexfrom capital expenditureValuation · All propertiesClosing valueOpening valueMaintenance capexfrom capital expenditureFair value movement
- How it is funded3 formulasDebtClosing balanceOpening balanceDrawdownsRepaymentsDebtInterest expenseOpening balanceAll-in interest rateshare of the yearEquity raisingEquity raisedEquity raised (net of costs)Equity from an offer, milestone funding, conversions and creditor shares
- How profit becomes cash3 formulasWorking capitalTrade receivablesRevenuefrom statementsDebtor daysDays in periodWorking capitalInventoryDirect costs (positive)from statementsInventory daysDays in periodWorking capitalTrade payablesCash operating costs (positive)from statementsCreditor daysDays in period
25 parts, each one tested.
Every part is a tested building block with its own checks: yours is put together from the ones your business needs.
- CPI forecastCPI glide path
- Corporate costsManagement expense ratio
- Working capitalDays-based working capital
- Income taxFlow-through entity (no entity tax)
- DebtSingle debt facility
- Equity raisingScheduled equity raisings
- Dividends and distributionsPayout of FFO
- Discounted cash flow valuationDCF on free cash flow to the firm
- Net asset valueBook net asset value
- Interest-rate hedgingHedged share at a fixed rate
- Key-metric summaryStandard growth, margin and leverage metrics
- Covenant tests and headroomLVR, gearing and ICR for property
- Discount rate (WACC)CAPM at target gearing
- Tenant receivables, bad debts and depositsArrears days and bad debt %Rent arrears and bad debts, rent received in advance, and security deposits or bonds held for tenants — the property-specific working-capital balances.
- REIT metrics (FFO, AFFO, NTA, gearing)FFO and AFFO (Property Council of Australia)The earnings, balance-sheet and portfolio metrics investors use for property owners — FFO and AFFO, NTA per unit, gearing and covenant headroom, WALE and occupancy, like-for-like growth and rent cover.
- Acquisitions, disposals and capital recyclingNamed acquisitions and disposalsProperties bought and sold during the forecast — named transactions, generic acquisitions at an assumed yield, and disposals that recycle capital — with transaction costs and gains or losses on sale.
- Trust and REIT tax statusAustralian attribution MIT with tax-deferred distributionsThe tax rules that come with trust or REIT status — distribution requirements, taxable subsidiaries, tax-deferred distributions and withholding on property income paid to investors.
- Interest-rate forecastFlat base rate
- Property registerFarm register (hectares, water and improvements)The facts every other part of the model builds on — size, units, ownership share and opening value.
- Rental incomeRent as a yield on property valueBase rent earned from tenants and the occupancy that drives it.
- Property operating costsOperating costs as % of rental incomeOutgoings and other costs of running the property (rates, land tax, insurance, cleaning, security, repairs, management).
- Net property incomeFull income waterfallProperty-level income less property operating costs.
- Capital expenditureMaintenance capex as % of valueMaintenance, refurbishment and development spend added to the property's value.
- ValuationLand rate per hectare plus water per MLOpening and closing property value and the fair value movement between them.
- Other property incomeCar park bays × rate × utilisationCar park, turnover rent, amenity fees, storage ancillaries and other income earned at the property.
The numbers it tracks.
- 01rent as % of value
- 02water entitlements (ML)
- 03value per hectare
- 04WALE
- 05AFFO per unit
- 06NTA per unit
- 07gearing
What it is used for.
- Operating forecastGuide · Financial projections
- Budget and rolling forecastGuide · Cash flow forecast
- ValuationGuide · DCF valuation model
- Lending and credit analysisGuide · Three-statement model
- Equity capital raisingGuide · Startup financial model
- Scenarios and sensitivities
- Asset acquisition
More in property investment and REITs.
- Property investment company financial model
- Diversified property group financial model
- Office REIT financial model
- Retail REIT (shopping centres) financial model
- Industrial and logistics REIT financial model
- Healthcare REIT financial model
- Net-lease REIT financial model
- Data centre REIT financial model
- Self-storage REIT financial model
- Hotel and resort REIT financial model
- Social infrastructure REIT financial model
- Cold storage property owner financial model
Looking for a farmland REIT financial model template? Ours arrives built for your business, with your figures in it.
See a finished model, sheet by sheetThe sample is built on illustrative figures and describes no real business. Models are calculations prepared from the information you provide. They are not financial advice and must be independently verified. See our terms.